Sports
A study on factors influencing digital sports participation among Chinese secondary school students based on explainable machine learning
Comparison of baseline variables between the two groups Detailed results are presented in Table 2. The participation of secondary school students in Digital Sports has resulted in two distinct groups: participants (n = 1007) and non-participants (n = 3918). Statistically significant differences (P < 0.05) were observed between the two groups in the following variables: gender, stage of secondary school, academic performance, […]

Comparison of baseline variables between the two groups
Detailed results are presented in Table 2. The participation of secondary school students in Digital Sports has resulted in two distinct groups: participants (n = 1007) and non-participants (n = 3918). Statistically significant differences (P < 0.05) were observed between the two groups in the following variables: gender, stage of secondary school, academic performance, self-assessed physical health, interest in ICT, perceived ICT competence, ICT Social Perception, mother’s education, father’s education, parents’ voluntary participation in sports, family wealth, ICT available at home, ICT available at school, Digital Teaching Training Level for Teachers, index proportion of all teachers with ISCED5A Master’s qualifications, and Weekly Number of Physical Education Days. No statistically significant differences (P > 0.05) were found for the following variables: BMI, body image, ICT autonomy, ISEI of mother, ISEI of father, parents’ emotional support, Home cultural possessions, home educational resources, whether School Digital Teaching Discussions with Staff, and school type.
Multilevel logistic regression results
16 variables with P < 0.05 from univariate analysis were included in the multilevel logistic regression model, with Table 3 presenting the results. The null model revealed significant between-school random variation in secondary school students’ likelihood of Digital Sports participation [σ_u2 = 0.26 (0.05), P < 0.001]. The ICC value indicated that 7.4% of the variance in Digital Sports behavior probability was attributable to school-level factors, justifying the use of multilevel modeling. Model 1 demonstrated significant positive correlations of weekly physical education class days (P < 0.001) and school ICT resources (P < 0.001) with Digital Sports engagement, accounting for 24.98% of between-school variance. However, neither digital training for teachers (P = 0.275) nor the proportion of teachers with master’s degrees (P = 0.172) showed significant associations. Model 2 identified significant student- and family-level predictors after adjusting for school-level variables (weekly physical education class days and school ICT resources). Even after controlling for student and family variables, weekly physical education class days (AOR 1.30, 95% CI 1.16–1.46) and school ICT resources (AOR 1.06, 95% CI 1.02–1.10) remained significantly positively correlated with Digital Sports participation. The final Model 3 highlighted household ICT resources (AOR 1.08, 95% CI 1.04–1.13) and students’ ICT social perception (AOR 1.18, 95% CI 1.07–1.30) as significant positive correlates, whereas academic performance exhibited a significant negative correlation (AOR 0.995, 95% CI 0.994–0.996).
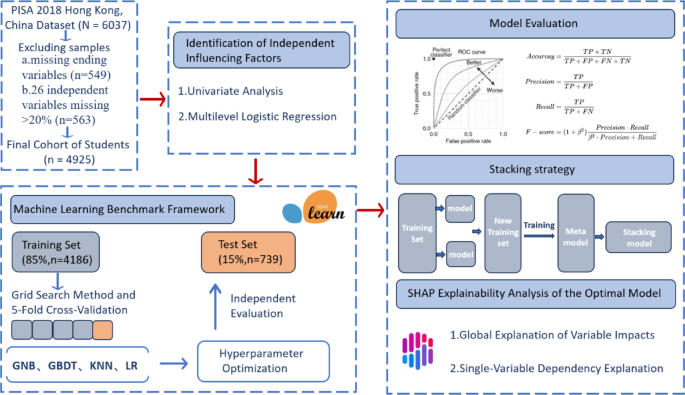
Model development and hyperparameter optimization
The five variables with P < 0.05 in the multilevel logistic regression were selected as input variables for model construction. After data standardization, the dataset was divided into training and test sets at a ratio of 85% (n = 4186) to 15% (n = 739). The grid search method exhaustively evaluates all possible combinations within specified parameter ranges to identify the globally optimal parameter configuration, thereby significantly enhancing the model’s generalization ability and computational efficiency. To optimize model performance, GridSearchCV combined with 5-fold cross-validation was employed for hyperparameter tuning of K-nearest neighbors (KNN), Gaussian naive Bayes (GNB), gradient boosting decision tree (GBDT), and logistic regression (LR). The optimized key parameters for each model are presented in Table 4, while non-critical parameters were set to their default values.
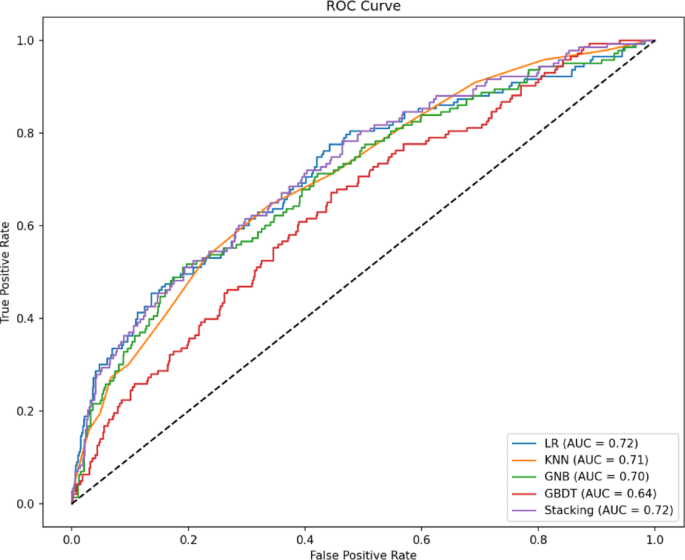
Model performance comparison
As shown in Table 5, the AUC values of GNB, GBDT, KNN, and LR models on the test set were 0.700, 0.641, 0.707, and 0.717, respectively. In this study, the AUC values of GNB, KNN, and LR models all exceeded 0.7, indicating their good discriminative performance in predicting secondary school students’ digital sports participation. Figure 2 presents the receiver operating characteristic (ROC) curves of the four prediction models, where the x-axis represents the false positive rate (FPR) and the y-axis denotes the true positive rate (TPR). Points closer to the top-left corner indicate higher model accuracy. The area under the ROC curve (AUC) reflects the predictive performance of the models, with larger AUC values indicating higher prediction accuracy. Among the primary models, the LR model performed best; however, as logistic regression is a linear model, it may fail to capture the nonlinear relationships between variables and the outcome. Therefore, this study constructed an ensemble stacking model using the LR model as the meta-model and GNB and KNN models as base models to enhance the interpretability of the conclusions. As shown in Table 5, the stacking model achieved an AUC of 0.723, outperforming the LR model and demonstrating better performance in terms of the F1 score.

Working feature curve of the test set using a machine learning model.
Explainability analysis
After completing the model development, explainability analysis was conducted on the best-performing Stacking model using the SHAP (SHapley Additive exPlanations) method. This analysis included global explanation of variable impacts and individual variable dependency explanation.
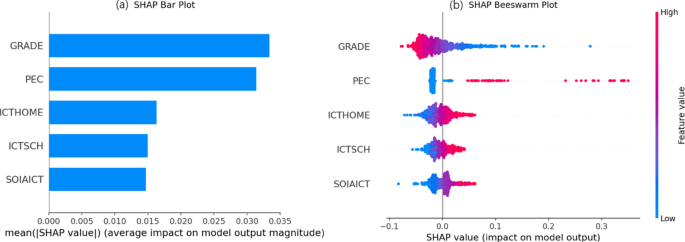
Global explanation of variable impacts
Figure 3a ranks the relative importance of the five influencing factors from high to low based on their mean absolute SHAP values: academic performance, weekly physical education class days, household ICT resources, school ICT resources, and ICT social perception. Among these, the SHAP mean values of academic performance and weekly physical education class days are significantly higher than those of other factors, indicating their importance as key determinants.
Figure 3b presents the SHAP beeswarm plot, where each point represents a sample distributed along the y-axis, and the horizontal position reflects its impact on the prediction outcome. The color gradient (red for high values, blue for low values) reveals that lower academic performance, more weekly physical education class days, richer household ICT resources, more sufficient school ICT resources, and higher ICT social perception are all significantly associated with an increased probability of secondary school students’ digital sports participation.

Importance ranking of SHAP features with swarm map.
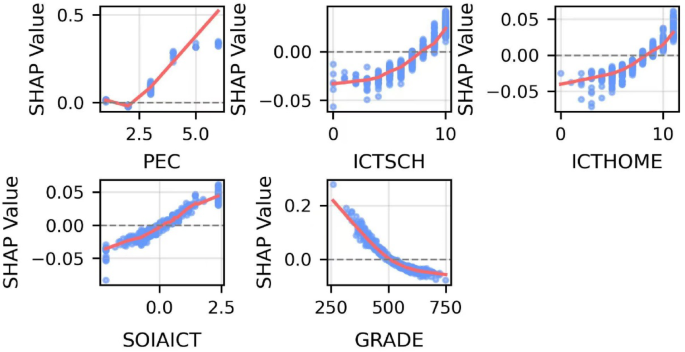
Single-variable dependency explanation
Figure 4 presents the feature dependence plots, illustrating the threshold effects and nonlinear relationships of five variables on secondary school students’ Digital Sports participation. When the number of weekly physical education class days (0 to 5 days) is 0 or 1, the SHAP values are near the zero line on the y-axis, indicating minimal or even negative effects on students’ Digital Sports participation. However, when the number of days reaches 2 or more, the model is more likely to predict participation, and the strength of this positive effect increases with the number of days. The impacts of school ICT resources and household ICT resources (0 to 10 points) on Digital Sports participation are similar: as these resources increase, the slope changes, suggesting that the effect strengthens with higher ICT resource availability. For values below 8 points, SHAP values remain below the zero line, indicating a model prediction of non-participation; only when values exceed 8 points does the model predict participation, highlighting the high ICT resource requirements for Digital Sports behavior. The lowess curve for ICT social perception reveals a largely linear positive relationship: when social perception exceeds the student population average, SHAP values rise above the zero line, and the model predicts participation. The slope changes in academic performance indicate that when scores range from 250 to 500, the model tends to predict participation, with a stronger negative effect as scores increase; beyond 500 points, the model tends to predict non-participation, and the negative effect gradually weakens with higher scores.