Sports
Beach Volleyball Advances to Final Day of the CUSA Championships
YOUNGSVILLE, La. – Tulane Beach Volleyball is currently 2-1 at the Conference USA Championships in Youngsville, LA. The #2 seed Green Wave will contend on championship Saturday, first facing FIU in a rematch of today’s quarterfinal match. Tulane started the tournament on Thursday with a 3-0 sweep of Tarleton State, taking down the Texans in less […]
Tulane started the tournament on Thursday with a 3-0 sweep of Tarleton State, taking down the Texans in less than forty minutes. The Green Wave secured victories on court 3 (Sam Green / Sara Hall), court 4 (Gigi Gallegos / Sam O’Connor) and court 5 (Avery Burks / Amelia Mullen).
The first-round win propelled the Green Wave to face the #3 seed FIU on Friday morning after they beat Missouri State in their first-round matchup.
Tulane picked up their second win of the tournament with a thrilling 3-1 over the Panthers securing wins on court 1 (McKenzie Cutler / Emily Heintzelman), court 2 (Skylar Ensign / Molly Trodd), and court 5 (Avery Burks / Amelia Mullen). Cutler and Heintzelman clinched the match as Heintzelman recorded a block on the final point for the victory.
The win advanced the Green Wave to the semifinals on Friday afternoon to take on the #1 seed FAU. FAU advanced to the semifinals with wins over Jacksonville State and UAB.
The Owls avenged their regular season loss to the Green Wave by taking the match 3-1 to advance to the championship game on Saturday. The Green Wave point came on court 3 (Sam Green / Sara Hall) in straight sets (21-17, 21-14).
The Wave will play FIU in the second semifinal at 9:00am CT on Saturday morning as the Panthers advanced with wins over UTEP and UAB on Friday. The winner of the match will advance to take on FAU at 11:00am CT for the CUSA Championship and an automatic bid into the NCAA Tournament.
Tulane 3, Tarleton State 0
- Emily Heintzelman/McKenzie Cutler (TUL) vs. Halcomb/Bryant (TAR) 21-18, 16-9, unfinished
- Skylar Ensign/Molly Trodd (TUL) vs. Schirpik/Huber (TAR) 21-18, 18-10, unfinished
- Samantha Green/Sara Hall (TUL) def. Brown/Parayno (TAR) 21-11, 21-11
- Gigi Gallegos/Sam O’Connor (TUL) def. Bendele/Mitchell (TAR) 21-10, 21-11
- Avery Burks/Amelia Mullen (TUL) def. Chun/Ching (TAR) 21-7, 21-17
Tulane 3, FIU 1
- Emily Heintzelman/McKenzie Cutler (TUL) def. Gray/Panko (FIU) 13-21, 21-16, 15-13
- Skylar Ensign/Molly Trodd (TUL) def. Vogel/Robinson (FIU) 21-13, 21-12
- Samantha Green/Sara Hall (TUL) vs. Drozd/Luoma (FIU) 21-19, 20-22, 12-13, unfinished
- Cahill/Franklin (FIU) def. Gigi Gallegos/Sam O’Connor (TUL) 21-18, 21-15
- Avery Burks/Amelia Mullen (TUL) def. Chudzik/Brown (FIU) 17-21, 21-16, 17-15
Tulane 1, FAU 3
- Svoilova/Adams (FAU) def. McKenzie Cutler/Emily Heintzelman (TUL) 21-18, 21-11
- McLaughlin/Honzovicova (FAU) def. Skylar Ensign/Molly Trodd (TUL) 18-21, 21-18, 15-13
- Sara Hall/Samantha Green (TUL) def. Vandeusen/Wolf (FAU) 21-17, 21-14
- Gigi Gallegos/Sam O’Connor (TUL) vs. Strandberg/Schroder (FAU) 21-10, 21-23, 11-13, unfinished
- Starling/Mignerey (FAU) def. Avery Burks/Amelia Mullen (TUL) 21-17, 14-21, 15-8
TICKETS
Tickets for the current baseball season can be purchased by calling 504-861-WAVE (9283), logging on to TulaneTix.com or visiting the ticket office at the James W. Wilson Jr. Center.
SOCIAL MEDIA
Follow Tulane bowling on Twitter and Facebook and Instagram. Follow Tulane Athletics on Twitter, Facebook, and Instagram.
WE ARE NOLA BUILT
Tulane University is located in the city of New Orleans. It is a city built on tradition and resiliency. The lessons Green Wave student-athletes have learned through their connection with this university and city have BUILT doctors, lawyers, business leaders, conference champions, all-conference players, All-Americans, professional athletes and NCAA tournament teams. The city of New Orleans has shaped us into who we are today. We are One City. We are Tulane. We are NOLA BUILT. Check out our story at NolaBuilt.com.
Sports
Volleyball Championship on ESPN Showcased Athletes and Gulf Shores
I’ve covered a lot of sporting events in my career, but there was something undeniably electric about the 2025 NCAA Women’s Beach Volleyball Championship this weekend in Gulf Shores. From the very first serve to the final point, it wasn’t just a tournament—it was a statement. And what a statement TCU made. The Horned Frogs […]
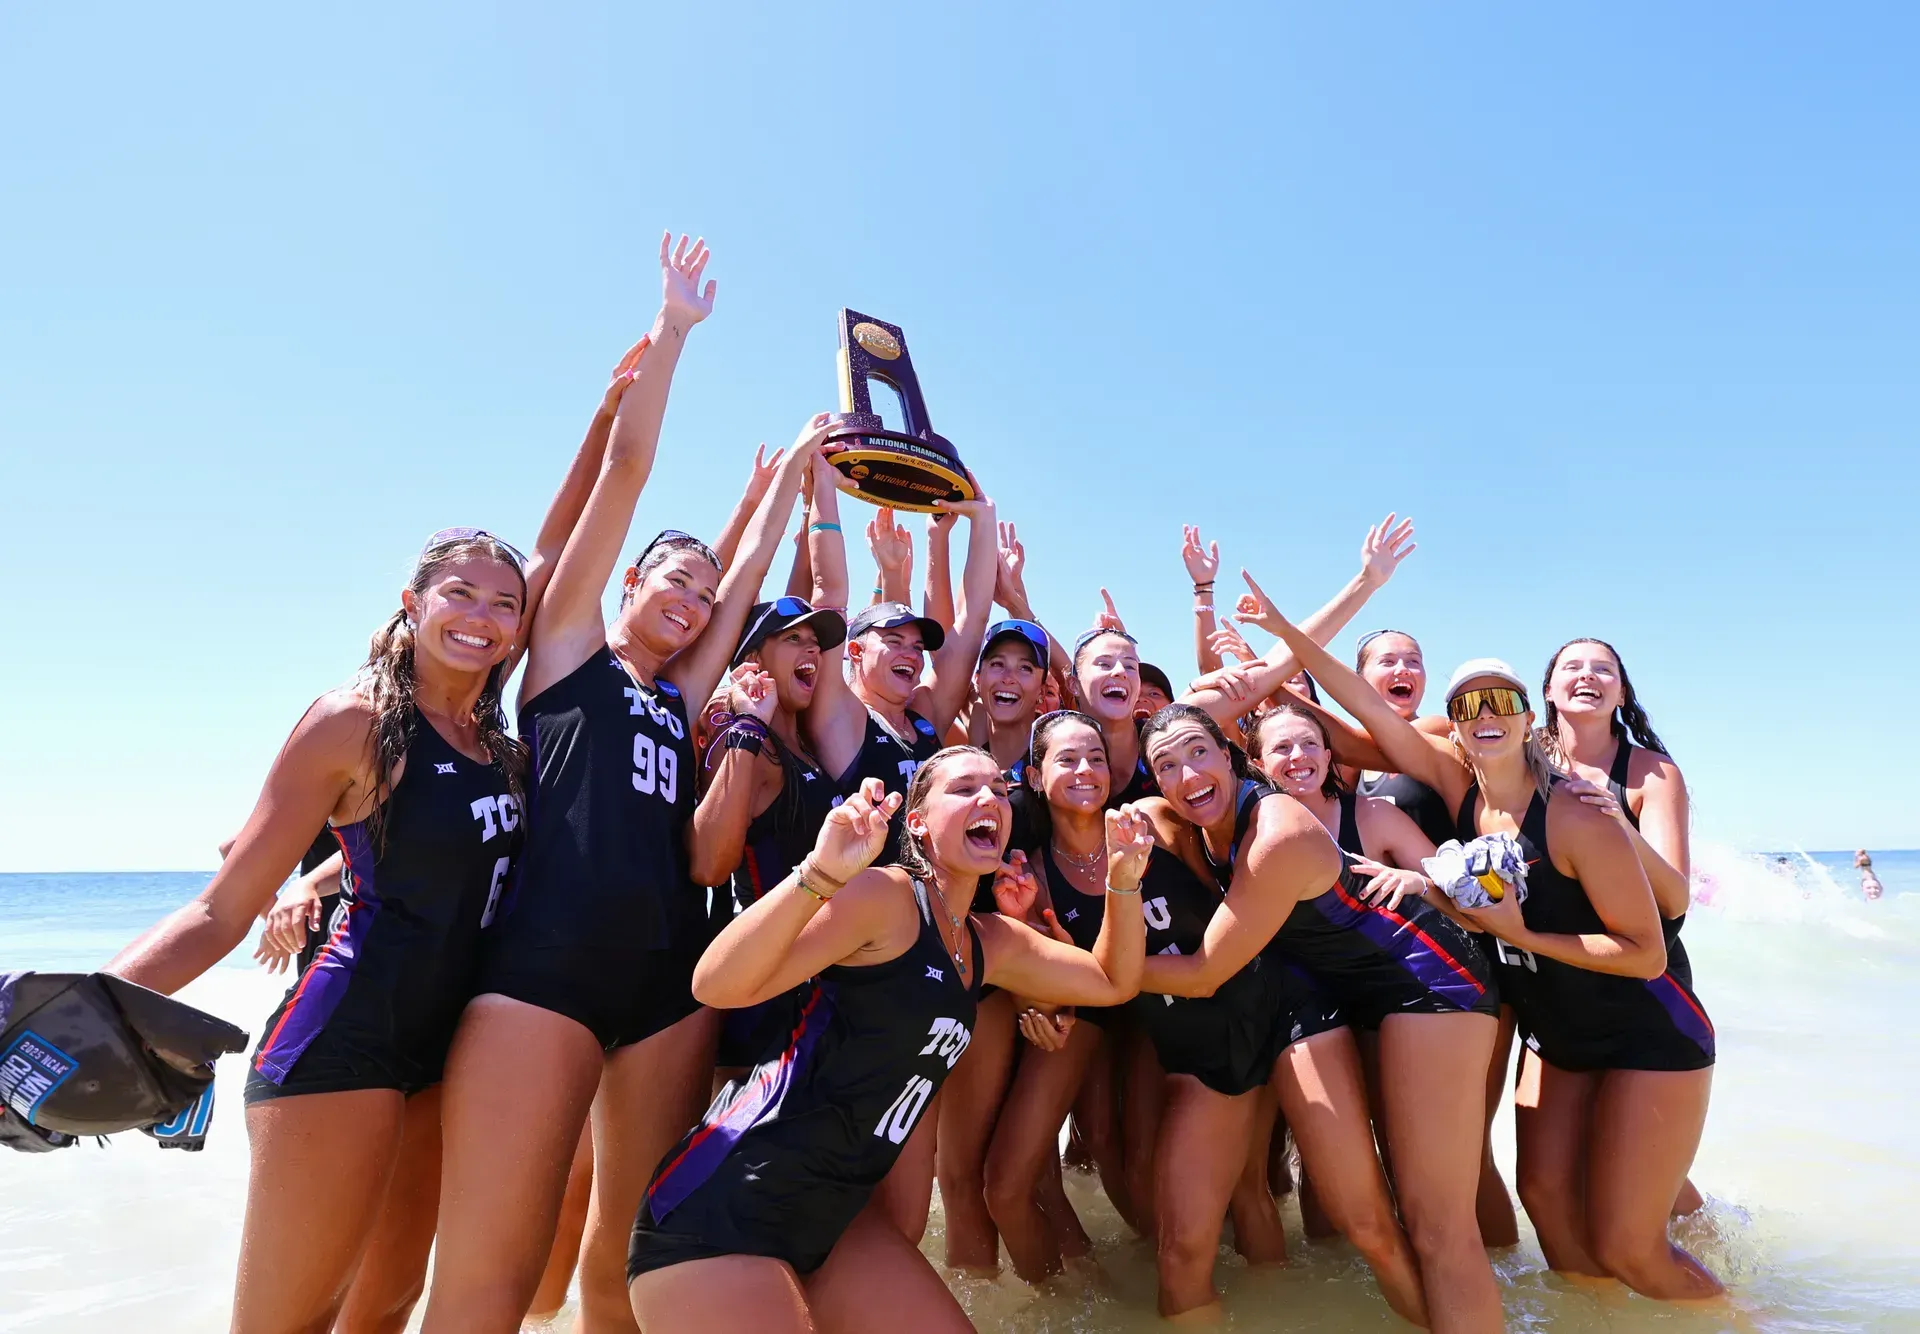
I’ve covered a lot of sporting events in my career, but there was something undeniably electric about the 2025 NCAA Women’s Beach Volleyball Championship this weekend in Gulf Shores. From the very first serve to the final point, it wasn’t just a tournament—it was a statement.
And what a statement TCU made.
The Horned Frogs claimed their first-ever national title in a dramatic 3-2 win over Loyola Marymount University (LMU). It wasn’t just a win—it was a seismic shift. For the first time in championship history, neither UCLA nor USC hoisted the trophy. Instead, a hungry, fearless TCU team stood victorious on the white sands of Alabama, redefining the power map of collegiate beach volleyball.
I was on the ground, and let me tell you, the energy was unreal. The athletes? Dialed in. The fans? Fired up. And the vibe? Pure magic.
What impressed me the most wasn’t just the level of play—it was the heart. The hustle. The belief. The grit. TCU didn’t just win points—they fought for them. Digs that looked impossible, blocks that rocked the court, and serves that sliced through the wind like laser beams.
This wasn’t just a win for TCU—it was a win for every program fighting to prove they belong. The whole event, set behind The Hangout in Gulf Shores, felt like a festival of athleticism. You had people dancing on tables during timeouts, cheering in the sun, and celebrating every rally like it was a Super Bowl play. And with over 450 matches across all divisions just days earlier at the AVCA Small College Championship, Alabama is officially the new heart of beach volleyball in May.
LMU had its share of shining moments, but this was TCU’s time. As the final point hit the sand, sealing both the match and a legacy, their players stormed the court in a rush of tears and screams–culminating in a celebratory dog pile that marked their historic win.
Adding to the excitement, two programs—Texas and Boise State—made their inaugural appearances at the NCAA Beach Volleyball Championship. Texas, seeded No. 7, earned a hard-fought 3-2 win over No. 10 California before falling to eventual champion TCU in the quarterfinals. Boise State, seeded No. 14, took on No. 3 Stanford in the opening round. Though they didn’t advance, their presence on the national stage marked a proud and promising milestone for the program.
I walked away from the finals with sand in my shoes, a camera full of unforgettable moments, and soaking wet from jumping into the Gulf to capture that iconic shot of the team hoisting the trophy in the water after their win. Totally worth it!!!
NCAA Women’s Beach Volleyball isn’t just growing, it’s thriving. And if this weekend proved anything, it’s that the best is yet to come. Until next year—same beach, even more magic!
Sports
Track and Field Wrap up Regular Season; Sacha Moves up in Program All-Time Performances
Story Links NASHVILLE – SIUE track and field wrapped up their regular season yesterday with Vanderbilt’s Music City Challenge. The Cougars saw strong performances across the board. Konrad Sacha placed fourth in the men’s 400m at 47.44. This moves him from fifth to fourth in the programs all-time outdoor […]
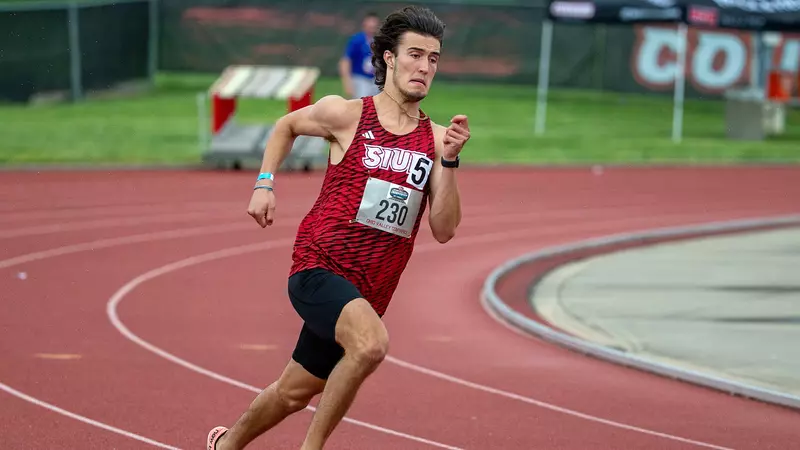
NASHVILLE – SIUE track and field wrapped up their regular season yesterday with Vanderbilt’s Music City Challenge. The Cougars saw strong performances across the board.
Konrad Sacha placed fourth in the men’s 400m at 47.44. This moves him from fifth to fourth in the programs all-time outdoor performances.
Drew Tucker claimed first in the men’s high jump at 2.00m (6-6 3/4).
Taylor Lehman placed second in the men’s 400m hurdles at 53.35.
Vashanti Reynolds placed second in the women’s 100m hurdles at 13.88.
Grant Milbrath placed fourth in the men’s hammer throw at 58.65m (192-5). He also placed third in the men’s shot put at 15.98m (52-5).
Maryiah Menicucci places second in the women’s hammer throw at 45.08m (147-11). She also competed in the women’s shot-put placing sixth at 12.28m (40-3)
THROWS
Gabby Yaccino placed eight in the women’s discus at 39.96m (131-1). Also competing was Allison Sanders (14th/37.04/121-6) and Abigail Irvin (18th/31.78/104-3).
Also competing in the men’s hammer throw was Joel Degracia placing 12th at 43.78m (143-8).
Sanders also competed in the women’s hammer throw where she placed sixth at 45.96m (150-9) and was followed by Gabby Yaccino in seventh at 44.36m (145-6).
Abigail Irvin competed in the women’s shot put placing 19th at 8.63m.
JUMPS
Sheena Cumberbatch placed 10th in the women’s long jump at 5.35m. She also competed in the women’s triple jump placing 10th at 11.32m (37-1).
Zaria Searcy tied for seventh in the women’s high jump at 1.62m (5-3). Also competing in the women’s high jump was Harper Smith who tied for ninth at 1.50m (4-11).
SPRINTS & HURDLES
Jazmin West placed fourth in the women’s 100m at 12.24. Also competing was Darrell Rice (18th/12.97).
In the women’s 100m hurdles Kaylee Allen placed 11th at 12.29
Also competing in the women’s 100m hurdles was Mia Jackson, she placed fifth at 14.33.
In the women’s 400m hurdles was Megan Derrick who places 16th at 1:06.77 and Kennedy Williams in 18th at 1:08.30.
Also competing in the men’s 400m hurdles was Simon McClaine. He placed fifth at 54.25. McClaine also competed in the men’s 110m hurdles placing sixth at 14.87.
Mia Jackson placed 17th in the women’s 200m, crossing the finish line at 24.54. Following her was Kaylee Allen (25th/25.14) and Jazmin West (31st/25.33).
In the men’s 200m Konrad Sacha placed 11th at 21.63. Also competing was Chase Burston who placed 30th at 22.45.
Also competing in the men’s 400m was Chase Burston in 19th at 50.49.
DISTANCE & MID-DISTANCE
For the women’s 3000m Kinze Shea placed sixth at 10:21.10.
In the women’s 3000m steeplechase Mia Loafman finished in 12th at 11.43.76. She was followed by Courtney Anthonies in 15th at 12:54.76.
Tanner Emerson competed in the men’s 3000m steeple chase placing seventh at 9:41.79.
Emilee Franklin ran the women’s 1500m placing 41st at 4:54.67. Following her was Ana Keller in 44th at 4:56.53.
In the men’s 1500m D’Andre Watson finished in 34th at 3:59.89. Following him was Logan Luttrell (38th/4:12.62), Jackson Edwards (39th/4:12.03) and Tyler Guthrie (41st/4:15.98).
Sophia Harrison ran the women’s 5000m placing 20th at 17:53.62. Erica Woodard followed in 33rd at 18:53.50.
Harrison also ran the women’s 800m placing 47th at 2:26.41.
RELAYS
For the men’s 4x100m Konnor Bouman, Jonah Grawer, Simon McClaine and Chase Burston placed third at 43.24m.
UP NEXT
The Cougars prepare for the Ohio Valley Outdoor Championships. This will be a three day event starting May 15th and wrapping up May 17th.
Sports
A study on factors influencing digital sports participation among Chinese secondary school students based on explainable machine learning
Comparison of baseline variables between the two groups Detailed results are presented in Table 2. The participation of secondary school students in Digital Sports has resulted in two distinct groups: participants (n = 1007) and non-participants (n = 3918). Statistically significant differences (P < 0.05) were observed between the two groups in the following variables: gender, stage of secondary school, academic performance, […]
Comparison of baseline variables between the two groups
Detailed results are presented in Table 2. The participation of secondary school students in Digital Sports has resulted in two distinct groups: participants (n = 1007) and non-participants (n = 3918). Statistically significant differences (P < 0.05) were observed between the two groups in the following variables: gender, stage of secondary school, academic performance, self-assessed physical health, interest in ICT, perceived ICT competence, ICT Social Perception, mother’s education, father’s education, parents’ voluntary participation in sports, family wealth, ICT available at home, ICT available at school, Digital Teaching Training Level for Teachers, index proportion of all teachers with ISCED5A Master’s qualifications, and Weekly Number of Physical Education Days. No statistically significant differences (P > 0.05) were found for the following variables: BMI, body image, ICT autonomy, ISEI of mother, ISEI of father, parents’ emotional support, Home cultural possessions, home educational resources, whether School Digital Teaching Discussions with Staff, and school type.
Multilevel logistic regression results
16 variables with P < 0.05 from univariate analysis were included in the multilevel logistic regression model, with Table 3 presenting the results. The null model revealed significant between-school random variation in secondary school students’ likelihood of Digital Sports participation [σ_u2 = 0.26 (0.05), P < 0.001]. The ICC value indicated that 7.4% of the variance in Digital Sports behavior probability was attributable to school-level factors, justifying the use of multilevel modeling. Model 1 demonstrated significant positive correlations of weekly physical education class days (P < 0.001) and school ICT resources (P < 0.001) with Digital Sports engagement, accounting for 24.98% of between-school variance. However, neither digital training for teachers (P = 0.275) nor the proportion of teachers with master’s degrees (P = 0.172) showed significant associations. Model 2 identified significant student- and family-level predictors after adjusting for school-level variables (weekly physical education class days and school ICT resources). Even after controlling for student and family variables, weekly physical education class days (AOR 1.30, 95% CI 1.16–1.46) and school ICT resources (AOR 1.06, 95% CI 1.02–1.10) remained significantly positively correlated with Digital Sports participation. The final Model 3 highlighted household ICT resources (AOR 1.08, 95% CI 1.04–1.13) and students’ ICT social perception (AOR 1.18, 95% CI 1.07–1.30) as significant positive correlates, whereas academic performance exhibited a significant negative correlation (AOR 0.995, 95% CI 0.994–0.996).
Model development and hyperparameter optimization
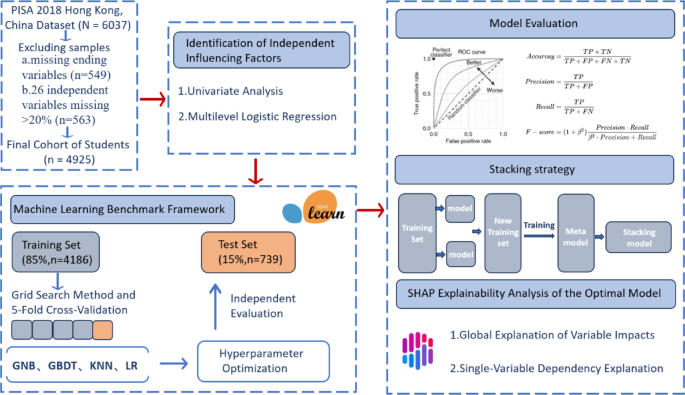
The five variables with P < 0.05 in the multilevel logistic regression were selected as input variables for model construction. After data standardization, the dataset was divided into training and test sets at a ratio of 85% (n = 4186) to 15% (n = 739). The grid search method exhaustively evaluates all possible combinations within specified parameter ranges to identify the globally optimal parameter configuration, thereby significantly enhancing the model’s generalization ability and computational efficiency. To optimize model performance, GridSearchCV combined with 5-fold cross-validation was employed for hyperparameter tuning of K-nearest neighbors (KNN), Gaussian naive Bayes (GNB), gradient boosting decision tree (GBDT), and logistic regression (LR). The optimized key parameters for each model are presented in Table 4, while non-critical parameters were set to their default values.
Model performance comparison
As shown in Table 5, the AUC values of GNB, GBDT, KNN, and LR models on the test set were 0.700, 0.641, 0.707, and 0.717, respectively. In this study, the AUC values of GNB, KNN, and LR models all exceeded 0.7, indicating their good discriminative performance in predicting secondary school students’ digital sports participation. Figure 2 presents the receiver operating characteristic (ROC) curves of the four prediction models, where the x-axis represents the false positive rate (FPR) and the y-axis denotes the true positive rate (TPR). Points closer to the top-left corner indicate higher model accuracy. The area under the ROC curve (AUC) reflects the predictive performance of the models, with larger AUC values indicating higher prediction accuracy. Among the primary models, the LR model performed best; however, as logistic regression is a linear model, it may fail to capture the nonlinear relationships between variables and the outcome. Therefore, this study constructed an ensemble stacking model using the LR model as the meta-model and GNB and KNN models as base models to enhance the interpretability of the conclusions. As shown in Table 5, the stacking model achieved an AUC of 0.723, outperforming the LR model and demonstrating better performance in terms of the F1 score.
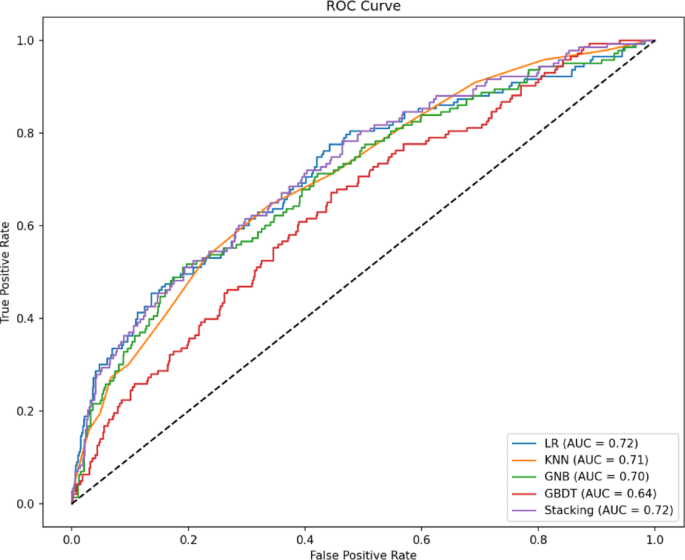
Working feature curve of the test set using a machine learning model.
Explainability analysis
After completing the model development, explainability analysis was conducted on the best-performing Stacking model using the SHAP (SHapley Additive exPlanations) method. This analysis included global explanation of variable impacts and individual variable dependency explanation.
Global explanation of variable impacts
Figure 3a ranks the relative importance of the five influencing factors from high to low based on their mean absolute SHAP values: academic performance, weekly physical education class days, household ICT resources, school ICT resources, and ICT social perception. Among these, the SHAP mean values of academic performance and weekly physical education class days are significantly higher than those of other factors, indicating their importance as key determinants.
Figure 3b presents the SHAP beeswarm plot, where each point represents a sample distributed along the y-axis, and the horizontal position reflects its impact on the prediction outcome. The color gradient (red for high values, blue for low values) reveals that lower academic performance, more weekly physical education class days, richer household ICT resources, more sufficient school ICT resources, and higher ICT social perception are all significantly associated with an increased probability of secondary school students’ digital sports participation.
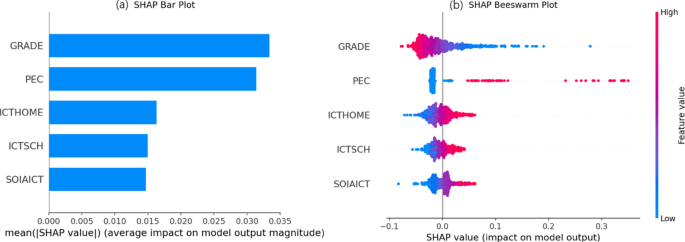
Importance ranking of SHAP features with swarm map.
Single-variable dependency explanation
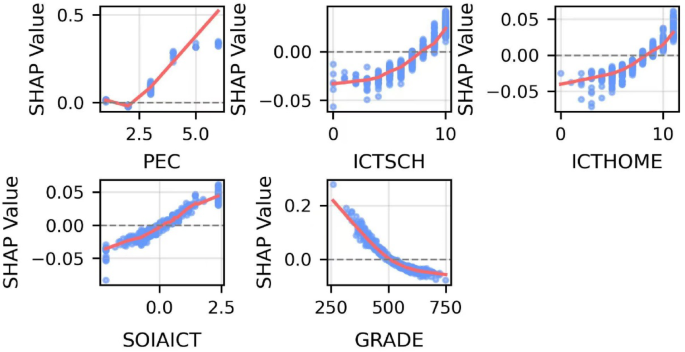
Figure 4 presents the feature dependence plots, illustrating the threshold effects and nonlinear relationships of five variables on secondary school students’ Digital Sports participation. When the number of weekly physical education class days (0 to 5 days) is 0 or 1, the SHAP values are near the zero line on the y-axis, indicating minimal or even negative effects on students’ Digital Sports participation. However, when the number of days reaches 2 or more, the model is more likely to predict participation, and the strength of this positive effect increases with the number of days. The impacts of school ICT resources and household ICT resources (0 to 10 points) on Digital Sports participation are similar: as these resources increase, the slope changes, suggesting that the effect strengthens with higher ICT resource availability. For values below 8 points, SHAP values remain below the zero line, indicating a model prediction of non-participation; only when values exceed 8 points does the model predict participation, highlighting the high ICT resource requirements for Digital Sports behavior. The lowess curve for ICT social perception reveals a largely linear positive relationship: when social perception exceeds the student population average, SHAP values rise above the zero line, and the model predicts participation. The slope changes in academic performance indicate that when scores range from 250 to 500, the model tends to predict participation, with a stronger negative effect as scores increase; beyond 500 points, the model tends to predict non-participation, and the negative effect gradually weakens with higher scores.
Sports
Isaac Busler, Brandon Kendrew help Grove City College track and field team win conf – Butler Eagle
Butler graduate and Grove City College junior Isaac Busler was part of the school-record-setting 1600-meter relay (3:19.56) as the Wolverines earned their third consecutive Presidents’ Athletic Conference outdoor men’s track and field title on Thursday and Friday. Seneca Valley grad and GCC freshman Brandon Kendrew placed third in the 110 high hurdles (15.9 seconds) at […]
Butler graduate and Grove City College junior Isaac Busler was part of the school-record-setting 1600-meter relay (3:19.56) as the Wolverines earned their third consecutive Presidents’ Athletic Conference outdoor men’s track and field title on Thursday and Friday.
Seneca Valley grad and GCC freshman Brandon Kendrew placed third in the 110 high hurdles (15.9 seconds) at the meet, held at West Virginia University’s Mylan Park.
Sports
Photo Album: Wabash Track and Field Awards Dinner – 2025
Photo Albums Wabash Track and Field Awards Dinner – 2025 Back to Photo Albums Wabash Track and Field Awards Dinner – 2025 Download Album Photos Link 3

Sports
Vandals Close Outdoor Regular Season With Strong Weekend
Story Links Oregon State High Performance Live Results Desert Heat Classic Live Results MOSCOW, Idaho – Three Vandals claimed first at the Oregon State High Performance, as Idaho moved up in the Big Sky rankings on the Vandals’ final meet […]
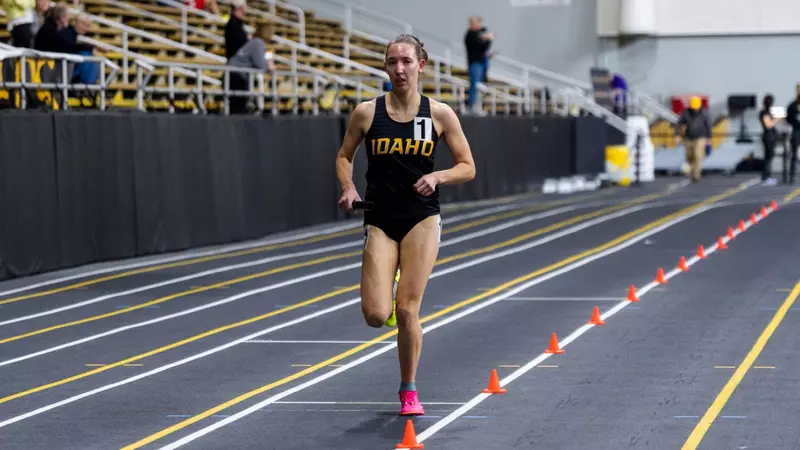
MOSCOW, Idaho – Three Vandals claimed first at the Oregon State High Performance, as Idaho moved up in the Big Sky rankings on the Vandals’ final meet weekend of the 2025 outdoor regular season.
“It was another successful weekend for our crews as we closed out the regular season in Oregon and Arizona,” Director of Track and Field Tracy Hellman said. “At Oregon State, the steeplers all set personal bests and improved their standing in the NCAA West Regional.”
Katja Pattis grabbed the top spot in the women’s 3K steeplechase with a career-best 10:04.33, the fifth-best time in the Big Sky and the second fastest in Idaho history. Constanze Paoli followed in third, as the sophomore also set a career-best in the event, a 10:18.09. Paoli now finds herself in the seventh spot in the Big Sky rankings. Pattis and Paoli now look to be set to compete in the NCAA West Regional later this month. Pattis’ time places her 18th on the qualifying list, as Paoli holds the 37th position. The top 48 in each event will clinch a spot in the West Regional held in College Station, Texas, at the end of May. Abigail Thomas also set a personal best on Friday, a 10:43.88 mark that places her 12th in the conference.
The Vandals swept the shot put titles in Corvallis, with Noah Culbertson and Mia Sylvester each on the top step of the podium. Culbertson’s 17.41-meter throw is his longest of 2025 and the fifth longest in the Big Sky this season. Sylvester also placed third in the discus after a throw of 43.51 meters, her longest since April of 2023. Additionally, the junior set a season-best in the hammer throw and is now one of only two athletes in the conference to hold a top-15 spot in the women’s hammer, discus, and shot put.
At the Desert Heat Classic, Jana Willems tied her career-best in the 100, improving on her previous season best by nearly two tenths. Blossom Omogor set an outdoor career best in the 400, racing to a time of 54.81, less than a tenth off the 25-year-old school record.
Three more Vandals found their way into the Big Sky top six in the high jump, as Dante Cox jumped over 2 meters for the first time in his outdoor career to finish eighth in Tucson. On the women’s side, Annika Jozin set her career best at 1.74 meters, and freshman Cami Cvitkovic leaped to 1.69 meters. Jozin is just the 12th Vandal woman to jump over the 1.70-meter mark.
Rhyan Madden and Lara Holzhauer both ran career-bests in the 400-meter hurdles, with both claiming top-11 spots in the Big Sky. They both finished just behind Franziska Stoehr, who’s season-best time of 1:00.29 is less than half a second off her career-best of 59.86, the fifth-fastest 400-meter hurdles time in school history. Stoehr now holds the sixth fastest time in the conference this season.
“Our jumpers and 400 hurdlers had nice improvements in their respective events and continue to improve their standing for Big Sky championships,” Hellman said. “We now turn our attention to the Big Sky championships and are motivated to hit our best physical and mental performance in Sacramento in 2 weeks.”
Idaho will take a week off before traveling to Sacramento, California, for the 2025 Big Sky Outdoor Championships beginning on May 14.
Fans can stay up-to-date on all things Idaho Track and Field by following the team on Instagram, @IdahoTrack.
-
 College Sports3 weeks ago
Former South Carolina center Nick Pringle commits to Arkansas basketball, John Calipari
-
 Rec Sports1 week ago
Deputies investigating incident that caused panic at Pace youth sports complex
-
 Fashion1 week ago
This is poetry in motion.
-

 High School Sports2 weeks ago
Appling County football to forfeit all 10 wins from 2024
-
 Sports3 weeks ago
Sports Roundup
-
 College Sports2 weeks ago
Lehigh wrestlers prepare for wrestling U.S. Open
-

 NIL3 weeks ago
Patriots Legend Rob Gronkowski Makes Surprising Career Move
-

 NIL1 week ago
Save Like a Pro: NIL money isn’t free cash—taxes take a bite! Set aside part of …
-

 Sports2 weeks ago
How to watch Yahoo Sports' NFL Draft Live show
-
 Fashion2 weeks ago
Watch Saudi Arabian GP free live stream


