Ducati adds 50 tiny sensors to motorbikes to amp up its racing game
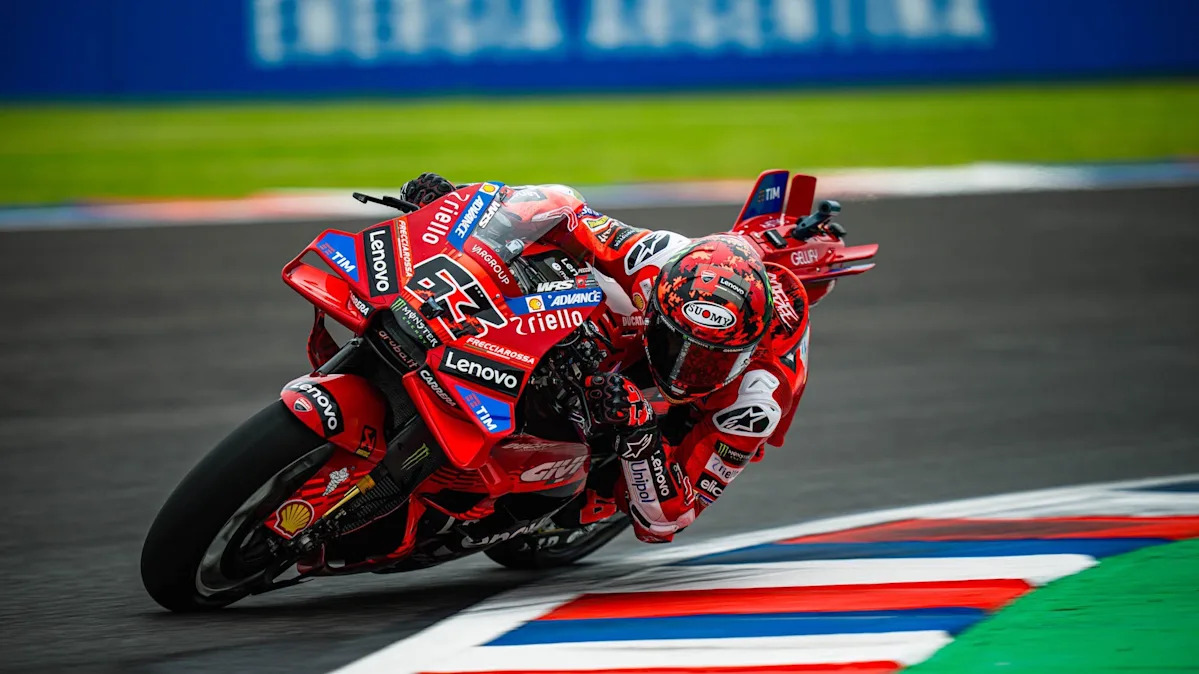
MotoGP is high-speed, high-tech motorcycle racing. The fastest riders in the world compete on specialized, purpose-built motorcycles from companies like Ducati, Honda, Yamaha on the world stage in this series, which is considered the most prestigious in the game. Riders reach incredible speeds on their machines up to 220 miles per hour, and races can […]
MotoGP is high-speed, high-tech motorcycle racing. The fastest riders in the world compete on specialized, purpose-built motorcycles from companies like Ducati, Honda, Yamaha on the world stage in this series, which is considered the most prestigious in the game. Riders reach incredible speeds on their machines up to 220 miles per hour, and races can go 350 turns with gravity-defying leaning that scrapes elbows and knees. This Grand Prix is for the toughest of the tough on the moto circuit.
Behind the riders and the machinery is a boatload of data and technology; we’re talking massive amounts of data in numbers that make your head spin. As tech company Lenovo puts it, when it comes to MotoGP–a sport in which every millisecond counts–data can mean the difference between a first and last place finish.
Advertisement
Lenovo and Italian motorbike manufacturer Ducati work hand in hand to create a champion racing team with information gathered by 50-plus sensors that track tire rotation, speed, grip, acceleration, and more. Motorcycle racing, at the highest echelon, has evolved way beyond just the machinery or even the skill of the rider. Without the technology, any team would be left in the dust.
The data journey
In the past, the only way to evaluate the outer limits of what a motorbike could endure was to disassemble a crashed bike. Today, a multi-pronged approach to data collection takes that process up several notches. Every time a bike enters the pit garage, an in-person team and a crew from the Ducati Lenovo Remote Garage at Ducati’s headquarters in Bologna, Italy analyzes performance.
Via 50 sensors on each bike, Ducati engineers collect tons of data they can parse and assess. Image: Ducati/Lenovo
No matter where the team is racing, data streams in from the motorbike sensors. Off-site engineers analyze information from the track, making tiny tweaks to the bike and its operation. That way, every qualifying lap may be reviewed and fine tuned for the best competitive outcomes.
Advertisement
“We debrief after each session, aligning with the rider on the sections and corners in which we think that he can improve his performance,” says David Attisano, the data and performance analysis manager for Ducati Racing. “We review with the rider his maneuvers and what we can expect to improve and how. For example, if the data shows that the rider can brake two meters later than he is, that’s a huge distance in this race.”
For the MotoGP series, Ducati has three different teams with a total of six riders. Each Ducati rider receives the data not just about his own ride but for all the other riders, so they can track what the other five are doing. That’s a giant amount of data.
“We can push each other to the limit because we can see what the other riders are doing and comparing, then we can highlight and suggest some changes in their riding style,” Attisano explains.
Through its partnership with technology company Lenovo, Ducati collects and analyzes data to push its bikes to the limit and win races. Image: Lenovo/Ducati
Data leads to improvements for road bikes, too
Per official MotoGP rules, the sensors can’t transmit the data while the bikes are in motion. As soon as the bike gets to the garage, the engineers download the data. From this point, the data analysis process begins. At this point, the partnership is especially critical as the servers are developed by Lenovo specifically for Ducati. On top of that, there are data signals created with a custom algorithm and simulating based on engineering knowledge about the bikes. The team can even create a detailed “digital twin” of the course that maps each twist and turn, using 200GB of data per circuit.
Advertisement
“If the rider tells us that the traction control is not working properly, our electronics engineers can adjust the ECU,” says Attisano. “In our competition, the human factor is very important. We rely on the data and the humans do the last mile to gain the result and to achieve victory.”
Sure, data clearly plays a big part, but human interpretation is still a critical aspect to translate the results. Even those who know nothing of motorcycles can create algorithms or artificial intelligence to offer some hints or tips, but without input from the team, the data has no context. The technology, Attisano emphasizes, is intended to augment the capabilities of human beings, not to replace them.
Italian motorbike manufacturer Ducati makes high-speed, high-tech machines. Image: Ducati/Lenovo
“The behavior of the bike is very complicated–it’s very difficult to understand if you have not studied it at university,” he says. “In our experience, the exchange of knowledge between engineers and data scientists is very important.”
Ducati’s data collection on the competitive side feeds into the safety and reliability for all riders, including those who like to take their motorbike for a spin on any given Sunday; not just competitive situations. Every time the bike emerges from the pit at a MotoGP race, the engineers strive to be sure it’s in good form and safe for the rider. Every improvement via the data collected from 50 tiny sensors on each factory-made racing bike leads to a better ride for casual street riders, too.
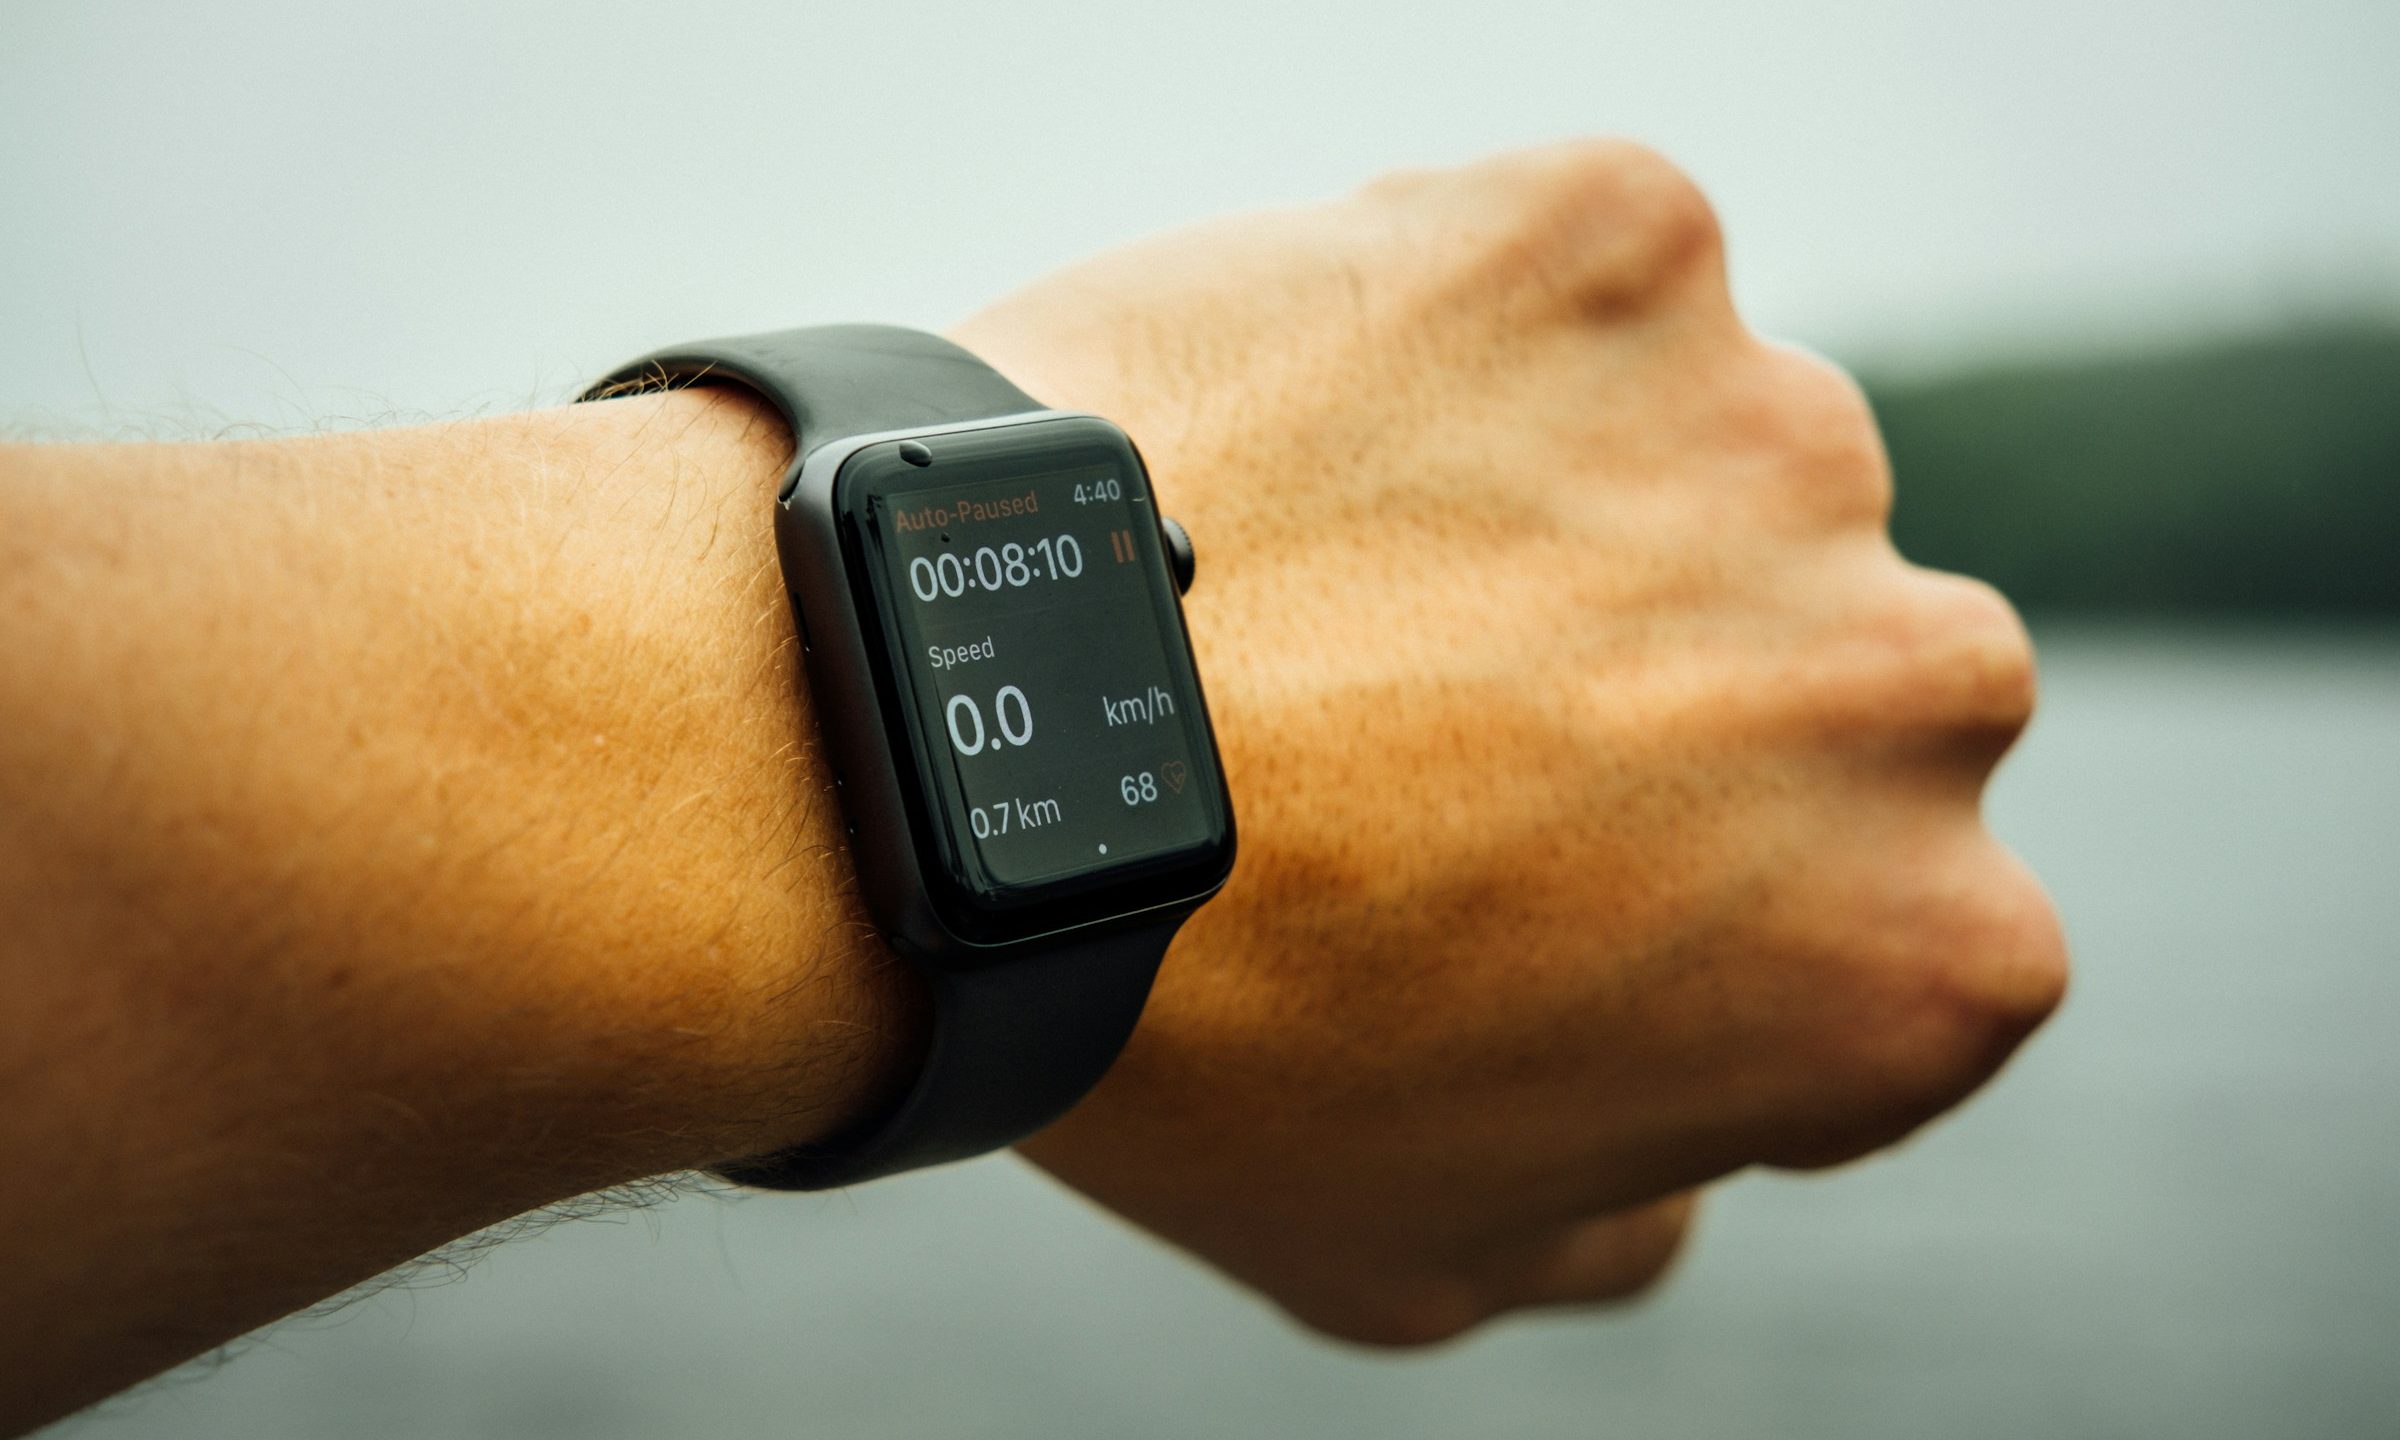
Fitness trackers are everywhere these days on iPhones and watches. Fitness enthusiasts and those trying to achieve their goals use these trackers to count steps, track workouts, and measure calories. With so many people depending on them for reliable data, it raises the question: How accurate are those wearables? Are we really getting the correct […]
Fitness trackers are everywhere these days on iPhones and watches. Fitness enthusiasts and those trying to achieve their goals use these trackers to count steps, track workouts, and measure calories. With so many people depending on them for reliable data, it raises the question: How accurate are those wearables? Are we really getting the correct data on our calories, heart rates, step counts, and more?
In a study published in the European Journal of Applied Physiology, the researchers note that wearable technology has been named the number one most popular trend, and this popularity is predicted to continue growing. Despite their merits and benefits, the researchers also highlight the significant limitations associated with the validity and reliability of the metrics measured from these devices. As they rightly say, advanced marketing doesn’t always equate to advanced technology.
Recently, a professor and doctoral student at the University of Mississippi set out to explore the accuracy of these wearables. Here’s the scoop.
New research
Cotton Bro / Pexels
In the new meta-analysis, researchers reviewed 56 studies that compared the popular Apple Watch to standard, trusted measuring tools for heart rate, step counts, and calories burned. They presented their study at the University’s Showcase of Research and Scholarly Activity session.
For this analysis, the researchers assessed the accuracy of the Apple Watch across different age groups, health statuses, and types of physical activity. They also tested various versions of the device.
The researchers raised concerns because some people are using these devices to help guide decisions about their medical conditions or workouts, so it’s important that the data is accurate. Otherwise, inaccuracy could cause confusion, overtraining, or even cause some people to miss health warnings.
The results
Ketut Subiyanto / Pexels
The results of this meta-analysis reveal that, overall, Apple Watches are accurate for measuring step counts and heart rate. The MAPE or mean absolute percentage error is a standard statistical measure that helps determine the accuracy of forecasts and predictions compared to actual values. Researchers calculated the difference between the data from the Apple Watches and the data from standard trusted measuring tools before calculating a “percentage error.”
Here are the MAPE results:
4.43% for heart rate
8.17% for step counts
For energy expenditure, the error increased to 27.96%, showing a more significant inaccuracy.
The researchers found this inaccuracy with all individuals and activities, including cycling, running, and walking.
The takeaway
Tim Foster / Unsplash
The takeaway is that while Apple Watches and similar devices can be useful tools in your fitness toolkit, they shouldn’t be considered a replacement for sound medical judgment or advice and standard clinical measuring tools and technology. It seems that, particularly with values like energy expenditure or calories, Apple Watches might not provide the most reliable data. These nifty little devices appear to be better at collecting certain types of data compared to others. As we can see in this analysis, the MAPE for heart rate was only 4.43%.
That being said, big companies like Apple are refining and improving their technology, which will hopefully enhance accuracy in the future for those of us who want to use fitness trackers.
Wearable Tech is Good. But Listening to Your Body Is Still Better.
<\/div><\/div>”],”filter”:{“nextExceptions”:”img, blockquote, div”,”nextContainsExceptions”:”img, blockquote, a.btn, a.o-button”},”renderIntial”:true,”wordCount”:350}”> If I told you that NASA has developed a radical new way of monitoring and quantifying your workouts, and that that method outperforms all others, you’d probably assume that it involves bleeding-edge science. There would be AI, and some sort of wearable or perhaps even injectable technology. It would […]
If I told you that NASA has developed a radical new way of monitoring and quantifying your workouts, and that that method outperforms all others, you’d probably assume that it involves bleeding-edge science. There would be AI, and some sort of wearable or perhaps even injectable technology. It would be very expensive.
But you’d be wrong, for reasons that tell us something important about the quest to transform training optimization from an art into a science. A new study by Mattia D’Alleva and his colleagues at the University of Udine compares different ways of assessing the “training load” of different workouts—and finds that a low-tech NASA questionnaire produces the most accurate results. The findings offer a reminder that outsourcing our training decisions to wearable tech algorithms doesn’t always outperform simply listening to our bodies. The research also raises a tricky question: is the workout that makes you most tired also the one that increases your fitness the most?
Why Does Training Load Matter?
The goal of training is to impose a stress—a training load—on your body that makes it tired in the short term but triggers adaptations that make it fitter in the long term. Going all-out in one workout isn’t constructive, even though it imposes a huge training load, because it leaves you too tired to train effectively the next day. The art of training is figuring out what mix of easy, medium, and hard workouts will enable you to accumulate the greatest possible training load over weeks and months without getting crippled by fatigue.
In its simplest form (as I discussed here), the training load of a workout is a combination of how hard you push and how long you push for. But the details get tricky. What’s the best measure for how hard you’re pushing? You could use pace, power, heart rate, heart rate variability, lactate levels, perceived effort, or other progressively more esoteric metrics. And how do you combine effort with duration? You can’t just multiply them together, because effort is nonlinear: running twice as fast for half the distance won’t produce the same training effect.
The new study, which is published in the International Journal of Sports Physiology and Performance, compares seven different ways of calculating training load. Four of them are variations on a concept known as TRIMP, which is short for “training impulse” and is based on heart rate measurements, using equations that account for lactate levels, breathing thresholds, and other details. A fifth uses heart-rate variability, and a sixth uses a subjective rating of effort. (Most fitness wearables, by the way, likely use a combination of the above methods, though their exact algorithms are typically proprietary.) The seventh method is the NASA questionnaire, which we’ll come back to.
The gold standard against which all these methods were compared is the “acute performance decrement,” or APD. Basically, you do an all-out time trial, then you do your workout, then you do another all-out time trial. Your APD is how much slower the second time-trial is compared to the first one, as a measure of how much the workout took out of you. Obviously this isn’t a practical way of monitoring training, because you can’t race before and after every workout. But for researchers, it’s a way of checking whether various methods—including the seven they tested in this study— correspond to the reality of how hard a workout is on your body. At the end, they were able to figure out which method was the most reliable predictor of training load.
What the New Study Found
D’Alleva and his colleagues recruited 12 well-trained runners (10 men and 2 women) to test four different running workouts on different days:
Low-intensity training (LIT): 60 minutes at a pre-determined comfortable pace
Medium intensity (MIT): 2 x 12:00 at a moderate pace with 4:00 easy recovery
Long high-intensity (HITlong): 5 x 3:00 hard with 2:00 recovery
Short high-intensity (HITshort): two sets of 11 x 30 seconds hard, 30 seconds easy
The performance test was running at VO2 max pace until exhaustion. When they were fresh, the runners lasted just under six minutes on average. After the one-hour easy run, their APD was 20.7 percent, meaning they gave up 20.7 percent earlier in the post-workout VO2 max run. After the medium-intensity run, the APD was 30.6 percent; after the long intervals, it was 35.9 percent; after the short intervals, it was 29.8 percent.
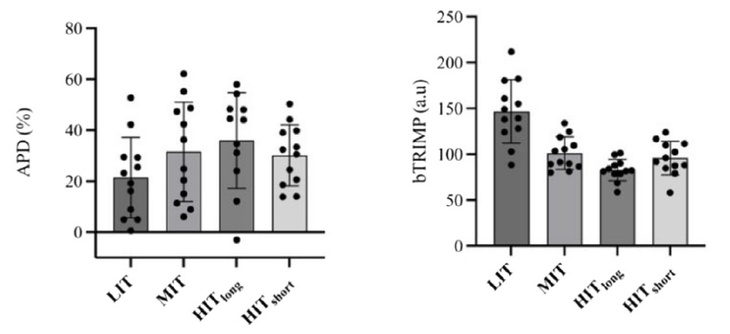
So how well were each of the seven training load calculations able to predict this APD? The short answer is: not very well. Here’s a comparison of APD (on the left) and one of the parameters studied, which is called bTRIMP and is based on heart-rate measurements and lactate curves:
The acute performance decrement (APD) is not accurately predicted by the heart-rate-based bTRIMP training load calculation. (Illustration: International Journal of Sports Physiology and Performance)
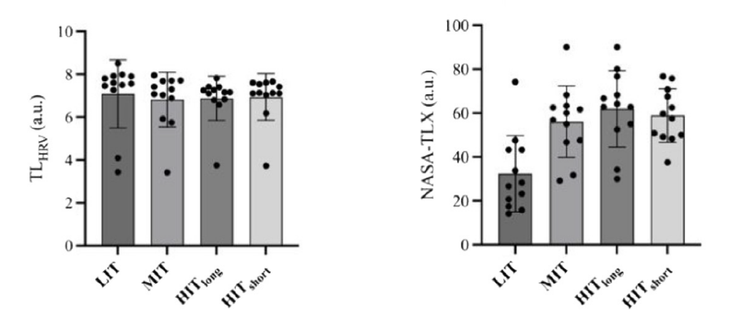
In fact, the relationships are completely reversed: the easiest workout according to bTRIMP produces the biggest APD in reality, and the workout ranked hardest by bTRIMP produces the smallest APD. All except two of the training load calculations the researchers measured have similar upside-down relationships. The two exceptions are heart-rate variability and the NASA questionnaire, which look like this:
Heart-rate variability (on the left) and a NASA questionnaire (on the right) offer differing perspectives on how hard workouts are. (Illustration: International Journal of Sports Physiology and Performance)
The heart-rate variability measures, on the left, don’t tell us much, because they’re basically the same after each of the four workouts. (You can see some subtle differences, but they’re not statistically significant.) The NASA questionnaire, on the other hand, bears a striking resemblance to the APD data, and the statistical analysis confirms that it’s a good predictor. In other words, it’s the only one of the seven calculations tested that, according to this study, accurately reflects how exhausted you are after a workout.
So what is this questionnaire? It’s called the NASA Task Load Index, or NASA-TLX, and was developed in the 1980s. It’s simply a set of six questions that ask you to rate the mental demand, physical demand, temporal demand (how rushed were you?), performance (how well did you do?), effort, and frustration of a task. You answer each of these questions on a scale of 1 to 100, then the six scores are averaged—and presto, you have a better measure of how hard your workout was than your watch or heart-rate monitor can provide.
What the NASA Questionnaire Misses
These results don’t mean that we should all start recording NASA-TLX scores in our training logs. Questions like how hurried you felt don’t seem very relevant to running, or to training in general. What’s more significant about the questionnaire is what it doesn’t include: any measure of how long the workout was.
All the other training load measures rely on a combination of intensity and duration. But the effect of duration swamps the measurement: that’s why the bTRIMP graph above shows the 60-minute easy run (LIT) as the workout with the biggest training load. It’s really just telling us that it was the longest workout. The NASA-TLX, on the other hand, just asks (in various ways) how hard the workout felt once it was done. That turns out to be a better way of predicting how much slower you’ll be after the workout.
There’s an implicit assumption in all of this discussion, though, which is that the workout that provides the biggest training load is the one that will improve your fitness the most. Is APD—how much slower you get over the course of a single workout—really the best predictor of fitness gains? It’s easy to come up with scenarios where that’s not true. If I sprain my ankle, my APD will be enormous, but that doesn’t mean I’m going to be an Olympic champion next month. Similarly, you can imagine workouts that would inflict a disproportionate amount of performance-sapping fatigue—steep downhill running, for example—compared to their fitness benefits.
Perhaps what we’re seeing here is not so much “good” (NASA-TLX) and “bad” (TRIMP) measures of training load, but rather good measurements for two different types of training load. The APD and NASA-TLX mostly reflect how hard/intense/fast the workout was. TRIMPs and other metrics that incorporate duration end up mostly reflecting how long the workout was. There’s no reason to assume that these two parameters are interchangeable. It’s not just that you can’t get the same training benefit by going twice as fast for half as long. It’s that there’s no equation that makes fast running produce the same benefits as slow running. They’re two different physiological stimuli, and the smart money says you need both to maximize your performance.
So where does this leave us? I’m not anti-data, and I’m open to the idea that some of the newer metrics provided by wearable tech might reveal useful patterns if you collect them consistently. But if you strip training down to its bare essentials, these results suggest to me that there are two separate parameters that really matter: how long and how hard. And for now, I’m not convinced that we have any measuring tools that are significantly better than a stopwatch and an honest answer to the question “How did that feel?”
For more Sweat Science, join me on Threads and Facebook, sign up for the email newsletter, and check out my new book The Explorer’s Gene: Why We Seek Big Challenges, New Flavors, and the Blank Spots on the Map.
The world of sports is constantly changing, which makes it essential to find a reliable, insightful, and entertaining source of information. That’s where RG comes into play. RG, a sports media platform based in the United States, provides exclusive sports news, in-depth interviews, and expert analysis. These services bring fans and professionals closer to the […]
The world of sports is constantly changing, which makes it essential to find a reliable, insightful, and entertaining source of information. That’s where RG comes into play. RG, a sports media platform based in the United States, provides exclusive sports news, in-depth interviews, and expert analysis. These services bring fans and professionals closer to the action, data, and decisions that shape their favorite sports.
A Purpose-Driven Platform
RG’s purpose is clear: to provide information, education, and entertainment. Their content is created for passionate fans, curious newcomers, or industry insiders to gain unique access and an informed perspective on the leagues, players, and games that matter most.
Mission: Insight You Can Trust
They strive to provide unique sports coverage powered by research and data. From headline-making interviews with athletes and coaches to statistical breakdowns and behind-the-scenes reporting, they offer content that fosters trust and transparency, two values that are often missing in today’s sports media.
What Sets RG Apart
Insider Access
They go beyond superficial stories. Their team reaches out to athletes, coaches, and insiders to bring you exclusive quotes, fresh angles, and meaningful context. You’ll not only comprehend what transpired but also why it matters.
Data-Driven Insights
Their research team discovers trends, performance metrics, and strategic insights by digging into the numbers. RG makes data easy to understand and act on, whether breaking down a game plan or analyzing player efficiency.
Up-to-Date Market Statistics
Are you searching for financial information related to sports? The Market Statistics section tracks real-time information across states, sportsbooks, and affiliates. Its resources, including user-friendly charts and graphics, are always up-to-date and accessible.
A Growing Fan Community
RG is a movement, not just a media outlet. Its social media platforms allow fans to exchange thoughts, ask questions, and connect about the sports they love. RG is open to interaction and believes that fan voices are worthy of being heard.
Independent and Objective Reporting
There is no bias, speculation, or spin in their content. They adhere to a strict code of accuracy and independence, guaranteeing you receive facts you can trust.
Expert Team, Unmatched Coverage
RG’s team, comprising seasoned journalists, analysts, researchers, and digital innovators, has extensive industry expertise and a relentless drive for storytelling. Their knowledge of the game is based on their studies, playing, and covering it.
Why Choose RG?
If you’re looking for honest, data-backed, and deeply reported sports journalism, RG is your go-to hub, not just a sports website. Their goal is to make sports media smarter, more transparent, and more connected to the actual moments and individuals that make it all possible. Their belief at RG is that trust, insight, and passion are necessary for great sports coverage. Their commitment to delivering content that brings fans closer to the heart of the game remains as the platform continues to grow.
With RG, you can access the world of sports, whether tracking rising stars, breaking news, or behind-the-scenes stats. A community of informed and engaged fans is being built, not just a platform. Whether you’re here for the information, the drama, or the conversation, welcome to a new age of sports media. Maintain your connection, curiosity, and involvement with RG.
To stay in the know about the latest developments, insider interviews, and game-changing analysis, follow them on X.
Fitness club resort leases San Jose site at prime spot in Santana Row
SAN JOSE — Life Time, a company that describes itself as an “athletic country club,” has signed a lease for a site occupied by Best Buy at Santana Row in San Jose, saying it hopes to open more Bay Area locations. Life Time leased a building at the southeast corner of Stevens Creek Boulevard and […]
SAN JOSE — Life Time, a company that describes itself as an “athletic country club,” has signed a lease for a site occupied by Best Buy at Santana Row in San Jose, saying it hopes to open more Bay Area locations.
Life Time leased a building at the southeast corner of Stevens Creek Boulevard and South Winchester Boulevard for its fitness- and health-oriented country club, according to documents filed on May 28 with the Santa Clara County Recorder’s Office.
“Santana Row is a great location,” said Meghan Akradi, a vice president of real estate with Life Time. “It’s hard to do better than Santana Row in terms of iconic properties.”
The building at 3090 Stevens Creek Blvd. is 60,000 square feet and is two stories, according to commercial real estate database Property Shark. The initial term of the lease is 15 years, Santa Clara County property documents show.
“This is a market where we’ve wanted to be for many years,” Akradi said. “We hope to open our San Jose location during the first half of 2027. It depends on how quickly we can get permits.”
The only Bay Area location for Life Time currently is in downtown Walnut Creek at 1315 Broadway Plaza.
The future San Jose location is expected to feature an array of amenities, according to Life Time.
“We will have great fitness areas, fitness studios, personal training sites, yoga, pilates, cafe, work lounges, a sauna, and hot tubs,” Akradi said. “We will have a kids’ academy.”
Minnesota-based Life Time takes a different approach to fitness than is the case with typical health clubs in the country, according to company executives.
“Members are calling us a country club without the golf,” said Natalie Bushaw, a spokesperson for Life Time.
In March, Fast Company placed Life Time at No. 23 on its list of the 50 most innovative companies of 2025.
“It goes much further than a typical gym,” Bushaw said. “Life Time takes a holistic approach to health, wellness, recovery and fitness. People can literally spend all day at Life Time, and they do.”
Life Time operates at least 175 athletic country clubs that have an average size of 100,000 square feet, according to the company’s website.
“It’s like a Four Seasons resort every time you walk into one of our country clubs,” Akradi said.
The company has 1.4 million members and 41,000 employees. Life Time also has at least 150 kids’ academy locations.
Life Time executives believe the company’s approach can capitalize on post-pandemic attitudes to staying healthy.
“Our company has come back stronger than ever,” Akradi said. “We are exceeding our pre-COVID member engagement, member satisfaction and member attention.”
Over the one-year period that ended in March, Life Time posted a profit of $207.5 million, an increase of 182.3%, or nearly triple the profits over the similar 12-month period the year before.
Revenue over the year-long period ending in March totaled $2.73 billion, an increase of 18.6% from the same period the prior year, according to Finance Charts.
“People are clearly emphasizing their health and wellness,” Akradi said. “We feel well positioned to continue to serve those people.”
Sponsored: The Importance of Reliability in Critical Broadcast Operations
Consumers today expect broadcast content to be available whenever, and wherever they want. Broadcasters are under increasing pressure to create and disseminate content in real-time and on-demand across an ever-growing number of platforms and formats. If they don’t, their competitors will. In this environment, downtime is not an option, and reliable broadcast operations are a […]
Consumers today expect broadcast content to be available whenever, and wherever they want. Broadcasters are under increasing pressure to create and disseminate content in real-time and on-demand across an ever-growing number of platforms and formats. If they don’t, their competitors will.
In this environment, downtime is not an option, and reliable broadcast operations are a must. This article will explore the impact of broadcast outages and the resulting downtime and explain what to look for in a technology partner to prevent it.
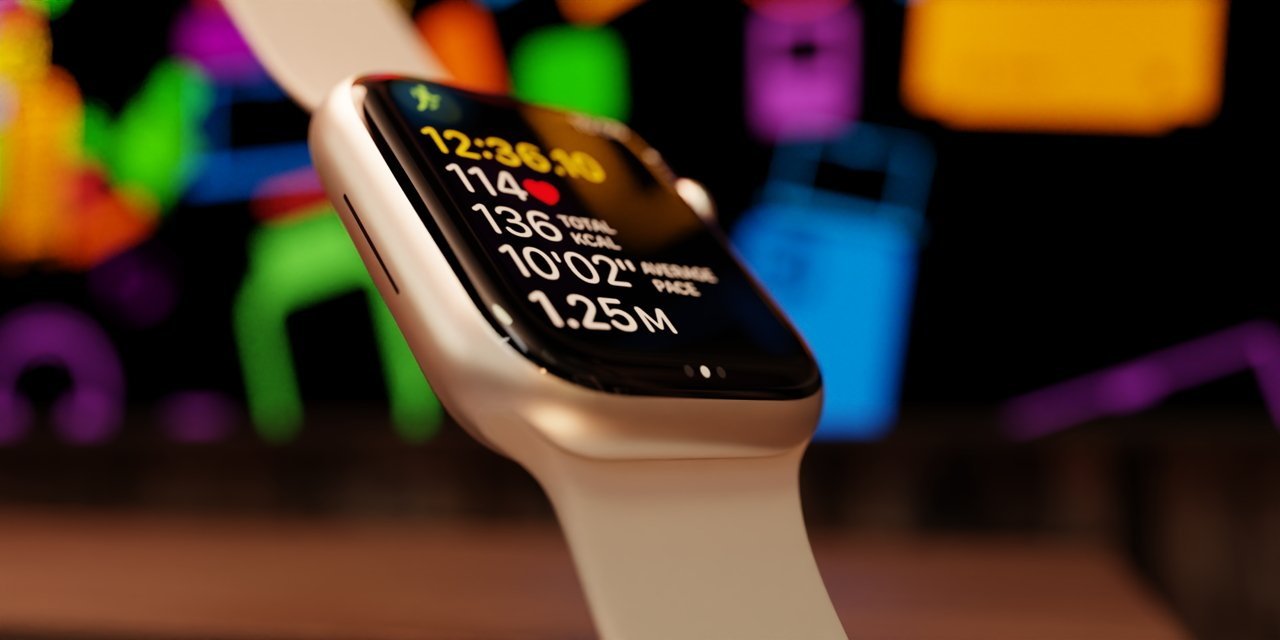
Apple Watch tracking accuracy studied in new analysis
The Apple Watch is pretty accurate — at least for certain metrics. A new University of Mississippi meta-analysis of 56 studies finds the Apple Watch delivers fairly accurate data for heart rate and step counts — but shows a much wider margin of error when it comes to calories burned.
In the year 2025, […]
The Apple Watch is pretty accurate — at least for certain metrics.
A new University of Mississippi meta-analysis of 56 studies finds the Apple Watch delivers fairly accurate data for heart rate and step counts — but shows a much wider margin of error when it comes to calories burned.
In the year 2025, wearable tech is almost startlingly common. If you walk into any gym in the United States, chances are you’re going to see wrists adorned with some kind of fitness tracker or smartwatch.
And it makes sense, too. Whether you’re concerned about your health or just looking to dial in your workouts, wearing an Apple Watch — or any other fitness tracker — seems like an ideal way to do it.
But that begs the question — just how accurate are health trackers like the Apple Watch? That’s the exact question that University of Mississippi researchers set out to answer.
The Apple Watch knows how much you move, not how much you burn
The Ole Miss study analyzed data from 56 studies comparing the Apple Watch data to clinical reference tools. Researchers took factors like age, existing health conditions, device age, and activity into account.
And, as it turns out, the Apple Watch is, well, fairly accurate.
If you’re using yours to track your heart rate or step count, they’re quite accurate. The study found mean absolute percent errors, a standard measure of accuracy, of 4.43% for heart rate and 8.17% for step counts.
Energy, expenditure, on the other hand, was notably less accurate. The study showed that when it came to tracking calories burned, the Apple Watch was inaccurate nearly 28% of the time.
The energy expenditure inaccuracy was observed across all types of users and activities tested, including walking, running, cycling, and mixed-intensity workouts.
The Apple Watch remains a useful tool, not a diagnostic device
So you may be wondering if this means you should throw your Apple Watch into the trash. Obviously, it doesn’t.
University of Mississippi professor Minsoo Kang, who headed the study, still thinks these trackers have a place.
“These devices are great for keeping track of habits and staying motivated, but do not take every number as 100% truth, especially the calories,” he told Eureka Alert. “Think of it as a helpful guide, not a diagnostic tool. It is useful but not perfect.”
While they’re not perfect now, that doesn’t mean they’re not improving over time, either. Newer models of Apple Watch appear to be significantly more accurate than previous iterations.
“While we cannot say every update is a big leap forward, there is a noticeable trend of gradual improvements over time,” Doctoral student Ju-Pil Choe said. “It shows that Apple is refining the technology over time.”
Kang remains optimistic about the future of wearable tech. He hopes that the study can help users make informed decisions about purchasing wearable tech and that it could help inspire fitness tech creators to reexamine where devices fall short.
“By showing where the weaknesses are, we can help developers get real feedback,” he says “They know what needs to be fixed, they can design better sensors or algorithms.”
“Our findings can guide improvements and help make these devices more useful for both everyday users and health care providers.”