
Rec Sports
Growth, maturation and health profiles of youth triathletes; Associati
Introduction
Triathlon is a dynamic and demanding endurance sport that combines swimming, cycling, and running into a single race. It is competed over varying distances, from short course races such as the Olympic distance event, consisting of a 1500m swim, 40km bike, 10km run, to long course events, including the ironman distance of 3.8km swim, 180km bike and 42.2km run.1,2 The 2020 Tokyo Olympics introduced a new event for triathlon, the mixed team relay. This event features teams of four athletes, two men and two women, with each competitor completing a super sprint triathlon of approximately 300m swim, a 6–7 km bike ride, and a 1–2 km run before tagging their teammate.3 This relay format adds a heightened level of intensity and a fast-paced element in comparison to the traditional Olympic distance event.
Performance in short course triathlon requires both high -volume and high-intensity training loads to achieve peak physical and mental conditioning.4 Training loads (defined as the physical stress an athlete experiences during their training over a set period of time)5 of more than 20 hours per week6 have been reported for short course triathletes. Training load is influenced by a variety of factors; duration, intensity, and frequency of these exercise modalities and can be quantified as externally (eg, power produced on the bike in watts) or internally (eg, heart rate or an athletes subjective response to load).7 Coaches may monitor this physical stress’ using a subjective rating scale (eg, rate of perceived exertion: RPE) on a scale from 1–10. Ongoing fatigue with high training loads can compromise the immune system and increase illness risk4 and also lead to a reduction in performance,8 put athletes at risk of injury and lead to time missed from training and competing.7,9
Each triathlon discipline places unique physiological and biomechanical demands on the body, leading to sport-specific patterns of fatigue and injury risk. Swimming primarily stresses the upper body and cardiorespiratory system, with primary injury risk to the shoulders and neck with the swim to bike transition adding additional metabolic load.10,11 Cycling emphasizes lower limb muscular endurance and spikes in power with the risk of overuse injuries to the back, neck and lower limbs and also the risk of acute injures from falls or crashes.12–14 Running imposes high impact loads on the musculoskeletal system with additional neuromuscular fatigue following the cycle to run transition with lower body overuse injuries common.15–17
Research focusing specifically on youth triathletes regarding injury and illness risk is limited; however, adolescents aged 12–19 years have been shown to experience higher rates of overuse injury compared to adult triathletes.9 Additionally, psychological factors such as stress and perfectionistic tendencies in youth triathletes have also been linked to increased vulnerability to injury.18 Recently, Crunkhorn et al19 reported two-thirds of injuries resulted in time loss to training and competition in a cohort of elite Australian triathletes over a 4-year period, with bone stress injuries (BSI) having the highest burden (31.38 days of time loss/365 days). Interventions to mitigate these risks of injury and illness should be prioritised for triathletes for sustained health, wellbeing and optimal performances.9
Within the Australian National Institute network (NIN), short course triathletes are supported by a team of professionals who monitor performance health through targeted services (such as Periodic Health Evaluations (PHE) to facilitate early detection and implementation of prevention strategies). Performance health reflects the ability of athletes to maintain their optimal physical, mental and social well-being, and to consistently complete all training sessions to optimize their chance of performance success.20
Youth Australian triathletes, aged 12 to under 19 years, are part of the national development pathway program but are not yet integrated into the NIN. These athletes have access to quality coaching, training camps, skills development, and athlete education outside their regular training environments but are not part of routine national health problem surveillance. While their performances are partially visible through national competitions, there is limited understanding of their health status and health history prior to entering the NIN, representing a critical gap in knowledge for early intervention and long-term athlete development.
Addressing this gap in health knowledge among these athletes is needed for optimising their performance health. Moreover, it may aid in the early identification of risk factors during their growth and maturation, a period recognised in the literature as one of heightened vulnerability to physical and psychological challenges in youth athletes.21,22
Growth refers to the physical increase in body size, typically observed through changes in height, weight, arm span and limb length, whereas maturation encompasses the progression toward full biological and sexual maturity, including skeletal and reproductive development.23 These processes are non-linear and highly individualized, influenced by genetic, environmental and nutritional factors.24,25
Monitoring growth and maturation is important for high-performance youth athletes due to differences that can occur between chronological age (CA) and biological age, significantly affecting their training load tolerance and injury and illness risk.22 Periods of rapid growth are associated with increased susceptibility to injury due to factors of rapid bone remodelling, soft tissues imbalances and a transient reduction in motor control and spatial awareness.26,27
Accurate and ongoing monitoring of growth and maturation is essential for informing individualized training prescription and recovery strategies. Common measures include skeletal maturity (expressed as bone age (BA)), sexual maturity (Tanner scale; age at first menarche) and age at peak height velocity (PHV).25 Age at PHV (APHV) can be predicted via equations based on CA and anthropometric measurements, as proposed by Mirwald et al.28
Describe the relationship between health history, growth and maturation, training loads and health problems in youth triathletes is paramount to support safe athletic progression. Therefore, this study aims to 1) understand health history, growth and maturation profiles and current health status of youth triathletes prior to entry into the NIN; 2) examine the associations between growth and maturation, training load, and health problem severity in youth triathletes with the goal of informing long-term appropriate training strategies for optimizing performance health outcomes.
Methods
Participants and Study Design
A total of 53 triathletes (30 males, 23 females) from the state pathway programs volunteered to participate in this study during the 2023–2024 triathlon season. Participants were between 12 and 18 years old (inclusive), and part of the state and academy programs who were able to travel nationally for training camps and competitions. Participant characteristics are reported in Table 1.
 |
Table 1 Health History Questionnaire Summary
|
The study employed a prospective observational design conducted over a 12-month period from January 2023 to January 2024. Growth and maturation measures were collected at three time points across both competition and training phases. Over a 10-week period, athletes completed four questionnaires: an initial athletic health history, followed by weekly reports on health problems, training load, and sessional RPE. The 10-week monitoring period was aligned with the collection of growth and maturation measures at weeks 1 and 10 (Figure 1).
 |
Figure 1 Overview of data collection, timeline and measures. Abbreviations: OSTRC-H2, Oslo Sports Trauma Research Centre Questionnaire on health problems. RPE, Rate of perceived exertion.
|
The study’s results were reported using the Strengthening the Reporting of Observational Studies in Epidemiology (STROBE) guidelines for observational studies.29 Ethical approval for the study was obtained from the University of Canberra Human Research Ethics Committee (Approval #202312112). For all athletes under 18 years of age, informed consent was provided from parents or guardians and assent was obtained from the athletes. Athletes aged 18 years, provided their own informed consent. The study complies with the Declaration of Helsinki.
Athletic History Questionnaire
An online Athletic History questionnaire was sent to participants or their parent/guardian via Email in week 1 of the 10-week data capture period. The questionnaire was conducted using the Qualtrics survey platform (Qualtrics Survey Software, 2023, www.qualtrics.com). The questionnaire recorded their background in sport, training load history, and previous health problems. Five questions related to female athlete health were included for female athletes. The athletic history questionnaire was developed in collaboration with industry allied health professionals and adapted from the clinical physiotherapy components of the PHE currently used in AusTriathlon (Supplementary File Figure 1).
Growth and Maturation Assessment
Anthropometric and growth measurements were collected at three time points; January 2023 (Time point 1), September 2023 (Time point 2), and January 2024 (Time point 3) (Figure 1). These corresponded, respectively, to the early competitive season (summer), start of season training (spring), and the subsequent competitive season (summer). All assessments were conducted at race venues and training camps representative of the athletes’ normal sporting environments.
All measurements were performed by the Chief Investigator AF, an International Society for the Advancement of Kinanthropometry (ISAK)30 accredited anthropometrist and a Sports and Exercise Physiotherapist with more than 20 years of clinical experience. Standardised ISAK anthropometric protocols were followed throughout and athletes received a familiarization session explaining the measurement procedures and expected duration at each time point.
Body mass (kg) was assessed using the A&D UC-321 digital series scale (A&D Ltd., Tokyo, Japan), while stretch stature (cm) and sitting stature (cm) were measured using the Seca 213 portable stadiometer (Seca GmbH & Co., Hamburg, Germany). Athletes were measured in light clothing without footwear. The stadiometer was positioned on a level surface and each measurement was taken twice, and the reported values reflect the average of these repeated measurements. The digital scale was calibrated prior to data collection. Growth tempo was evaluated by calculating the average monthly changes in height and arm span between Time point 1 to Time point 2, and Time point 2 to Time point 3.
To account for variations in biological development that extend beyond chronological age, additional assessments of skeletal and somatic maturation were included in the study. Estimated BA was calculated at all three time points using a validated prediction model equation (Cabral et al)31 that incorporates stretch stature (m), arm girth (cm), triceps skinfold (mm), humerus diameter (cm), and femur diameter (cm), CA, and sex. (Equation 1).31 These measurements were taken by the Chief Investigator AF, using Harpenden skinfold calipers and the Holtain bone anthropometer. Bone age offset was calculated as estimated BA minus CA.

Equation 1. Prediction model equation to estimate bone age using measures of arm girth, triceps skinfolds, humerus diameter, femur diameter, age, and sex, as described in Cabral et al (2013). Male sex: Dsex = 0; female sex: Dsex = 1, Stature = (standing height in m). Age (years), Tr = tricipital skinfold (mm), ACP = arm corrected perimeter (arm perimeter-tricipital skinfold, cm), HD = humeral diameter (cm), FD = femoral diameter (cm).
Somatic maturation was assessed using a spreadsheet developed by Towlsen et al,32 which applies sex-specific equations from Mirwald et al28 to estimate APHV and maturity offset (CA minus APHV). These calculations incorporate standing height, sitting height, weight and estimated leg length. Predicted adult height (PAH) was also calculated using the same spreadsheet,32 and the Khamis and Roche method33 which incorporates anthropometric data with mid-parental height. Data entry and calculations were performed by AF.
Health Problems
Participants were asked to complete the Oslo Sports Trauma Research Centre Questionnaire on health problems (OSTRC-H2)34 once per week for ten consecutive weeks. The questionnaire was conducted on the Qualtrics survey platform (Qualtrics Survey Software, 2023, www.qualtrics.com) and consisted of four questions that assessed any health problems the participants had encountered in the previous seven days. It covered aspects such as training participation, modified training or competition, performance, and the presence of health problem symptoms (Supplementary File Figure 2). Participants had the option to report multiple health problems if applicable. They were also required to provide details about the location, type of the health problem, and whether any modifications to their training or time away from training were necessary. Participants could also include additional details in a comment section and were asked whether they had consulted a healthcare professional regarding their health problem.
The severity of the injuries and illnesses reported using the OSTRC-H2 questionnaire was calculated according to previously documented methods in youth athletes.35 For each reported health problem, a severity score is given from 0 to 100 and is based on four key questions: 1) Limitation in sports participation, 2) Reduction in training volume, 3) Impact on sports performance, and 4) Presence and intensity of symptoms. Each question was scored from 0 to 25 and the total severity score was the sum of all 4 questions. Weekly reminders were sent to participants on Sunday afternoons via text message or email, and a follow-up reminder was sent on Monday if the questionnaire had not been completed. No additional reminders were provided after these. The data from the 10-week collection period was reviewed only after completion to prevent any bias in the interpretation of the results. Thirty-four (15 females, 19 males) participants completed at least one week of the questionnaire, with participants completing at least six weeks of the questionnaire on average (SD = 3.4, range = 1–10).
Training Load
Participants were asked to report on any training sessions and/or competitions they had completed in the previous seven days starting at Time point 2 (September 2023) once per week for ten consecutive weeks (Figure 1). This data was captured using the same online form used to capture health problems, as described above and this data capture period coincided with the start of the triathlon season training camps and finishing with competitions. Participants were asked to report on the type of session (swim, bike, run, or other), the duration of the session (in minutes), and their RPE for the session (Supplementary File Figure 2). Training load (au) was calculated as the product of duration (minutes) and RPE.36
Statistical Analysis
All analyses were conducted using R (version 4.4.2) in RStudio (version, 2024.12.1+563, Posit PBC, posit.co). Results from the Athletic History questionnaire, growth and maturation assessments, health problems and training load questionnaire are reported using descriptive statistics (Tables 1–3). A Bayesian framework was employed for statistical analysis and modelling of relationships between growth and maturation, health problems, and training load.
 |
Table 2 Growth and Maturation Characteristics Across the Three Data Collection Timepoints
|
 |
Table 3 Training Load Statistics Swim, Bike, Run and Other
|
The relationship between CA (centred) and BA offset, height tempo, and arm span tempo were each modelled using a gaussian mixed model with a random intercept for each participant, and an interaction term for CA (centred) and sex. To model the relationship between maturity offset and total severity (illness severity + injury severity), a hurdle lognormal mixed model was used. The hurdle component modelled the logit of whether a participant has 0 severity, or greater than 0 severity, and the lognormal component models the relationship between maturity offset and the natural logarithm of total severity.
A lognormal mixed model was used to model weekly training load according to participation, sport type (swim, bike, run, other), CA (centred) and sex. A random intercept was included for each participant and an interaction term was included for participation and sport type. Bayesian modelling was conducted using the brms R package.37 The posterior distributions of the model coefficients are presented as the median and 95% highest density credible intervals (HDI), and the probability of direction (PD, ie, the probability of a positive or negative effect).38
The sample size was based on convenience sampling from a finite population of eligible athletes who were accessible during the study period. As the total number of potential participants was limited, we aimed to include as many eligible and willing participants as possible. While the sample size was not determined by a formal power calculation, the Bayesian approach allowed us to quantify uncertainty in parameter estimates and assess the strength of evidence for our hypotheses given the available data.
Results
Athletic Health History Questionnaire
Twenty-seven participants (male = 15, female = 12) completed the health history questionnaire (Table 1). Participants ranged from school years 7 to 12, with seven engaged in casual employment and two in part-time roles. All participants competed in super sprint to sprint distance events with some (n = 18) incorporating strength and conditioning training, either independently, through personal trainers, or school programs. In addition to their triathlon training and competition, 16 participants (males = 10, females = 6) were involved in a range of other sports. The five most common additional sports were swimming competitions, surf lifesaving, soccer, athletic events, and Australian Rules Football (AFL). During childhood 24 athletes (males = 13, females = 11) reported broad multisport participation, often concurrently. Soccer, surf lifesaving and athletics the most common for both male and females alike. AFL was popular amongst male participants. Three female athletes had previously been accepted into youth high-performance academy programs; soccer, kayaking, AFL and gymnastics.
Both past and current health problems reported that had the most significant impact on training and competition included two female participants reporting ongoing current injuries from prior cycling accidents (shoulder rotator cuff and knees, hip and hand injuries). Additionally, a notable number of participants (n = 13; males = 7, females = 6) reported a history of growth-related injuries, with Severs the most common (n = 8). Other time loss health problems included appendicitis with complications (over 12 months), foot bone oedema (2 months) and a hamstring tear (3 months). Previous bone injuries included fractures (n = 18) and bone oedema (n = 2). Medical history intervention included surgical (adenoid/tonsil removal n = 6, appendectomy n = 1, hernia repair n = 1), orthopaedic evaluations for upper limb fractures n = 4, and hospital admissions (for cycling trauma n = 2, concussion n = 2, and stitches n = 3).
Among female participants (n = 9), the average age at menarche was 13.7 years ± 1.5, with an average cycle length of 28 days. However, eight participants reported menstrual irregularities, and one participant reported amenorrhea lasting approximately three months on two separate occasions. The menstrual symptoms most common were tiredness (n = 7), others were pain (n = 4), nausea (n = 4) and cramping (n = 4).
Growth and Maturation
Table 2 shows descriptive statistics for growth and maturation measures across Time points 1, 2 and 3. Figure 2A and B provide a descriptive visualization of maturity offset and the estimated APHV of the participant cohort, respectively. Additional data are provided in Supplementary File Table 1.
 |
Figure 2 (A) Distribution of maturity offset (CA minus APHV) among the participant cohort. (B) Relationship between chronological age (CA) and age at peak height velocity (APHV). Navy points represent observed values for participants with repeated measures across timepoints joined by a navy line. The grey dashed line shows 1:1 CA: APHV reference line.
|
For females at the mean CA, estimated BA was 1.58 (Bintercept (mean age, female) = 95% HDI = [1.22, 1.87]) years greater than CA, and this tended to remain consistent with an increase in age (Bage, female = 0.06, 95% CI = [−0.10, 0.21], PD = 0.79) (Figure 3A). On the other hand, for males at the mean CA, estimated BA was 1.23 (Bintercept (mean age, female) + Bmale = 1.24, 95% HDI = [0.93, 1.51], PD = 1.00) years greater than CA and this increased by 0.45 (Bage, female + Bage × male = 95% HDI = [0.30, 0.59], PD = 1.00) years with every additional year of CA (Figure 3A). The relationship between CA and BA offset depended on sex (Bage × male = 0.38, 95% HDI = [0.16, 0.58], PD = 0.99) (Figure 3B).
 |
Figure 3 (A) Relationship between chronological age (CA) and bone age (BA). (B) Relationship between CA and BA offset (BA minus CA). Navy points represent observed values for participants with repeated measures across timepoints joined by a navy line. The pink line and ribbon show estimated marginal means and 95% credible intervals for BA offset. The grey dashed line shows 1:1 CA: BA reference line.
|
The association between CA and height is presented in Figure 4A. The relationship between CA and height tempo did not vary by sex (Bage × male = 0.00, 95% HDI = [−0.13, 0.11], PD = 0.55) (Figure 4B). However, there was some evidence that height tempo was higher (by 0.09 cm per month) for males than females (Bmale = 0.09, 95% HDI = [−0.09, 0.27], PD = 0.85). Estimated height tempo at the mean CA was 0.30 cm per month for females (Bintercept (mean age, female) = 0.30, 95% HDI = [0.15, 0.43] and 0.39 cm per month for males (Bintercept (mean age, female) + Bmale = 0.39, 95% HDI = [0.27, 0.50]). Further, height tempo was lower for older athletes compared to younger athletes (by 0.09 cm per month for each year older) (Bage = −0.09 [−0.17, −0.02], PD = 0.99).
 |
Figure 4 (A) Relationship between chronological age (CA) and height. (B) Relationship between CA and height tempo (cm per month). Navy points represent observed values for participants with repeated measures across timepoints joined by a navy line. The pink line and ribbon show estimated marginal means and 95% credible intervals for height tempo.
|
The association of CA and arm span is presented in Figure 5A. Similar to height tempo, the relationship between CA and arm span tempo did not vary by sex (Bage × male = −0.03, 95% HDI = [−0.18, 0.11], PD = 0.68) (Figure 5B). Arm span tempo was higher (by 0.20 cm per month) for males than females (Bmale = 0.20, 95% HDI = [−0.01, 0.42], PD = 0.96). Estimated arm span tempo at the mean CA was 0.23 cm per month for females (Bintercept (mean age, female) = 0.23, 95% HDI = [0.07, 0.39] and 0.43 cm per month for males (Bintercept (mean age, female) + Bmale = 0.43, 95% HDI = [0.29, 0.57]). Unlike height tempo, there was relatively weak evidence to suggest that arm span tempo was lower for older athletes compared to younger athletes (Bage = −0.02 [−0.11, 0.06], PD = 0.69).
 |
Figure 5 (A) Relationship between chronological age (CA) and arm span. (B) Relationship between CA and arm span tempo (cm per month). Navy points represent observed values for participants with repeated measures across timepoints joined by a navy line. The pink line and ribbon show estimated marginal means and 95% credible intervals for arm span tempo.
|
Health Problems
During the 10-week data capture period for the health problems questionnaire, there were a total of 36 unique health problems reported from 20 athletes (7 out of 15 females, 13 out of 19 males). The reported health problems consisted of 22 illnesses (from 16 athletes: 6 females and 10 males) and 14 injuries (from 11 athletes: 4 females and 7 males). Out of the 20 athletes that reported any health problem, 7 athletes (3 females and 4 males) reported both an injury and an illness (at least 1 of each). Reported illnesses consisted of respiratory (16 total, 7 females, 9 males), gastrointestinal (3 total, all males), stress or external factors (2 total,1 female, 1 male), and menstrual (1 total). Reported injuries consisted of pain in the lower and upper leg (2 total, both from males), stress reaction (1 male), stress fracture (1 male), strain (lower back 1 male, upper arm 1 females), trauma in the upper leg (1 female). Further, there were 7 injuries reported (3 females and 4 males) where the location and type were not reported and have been listed as “unknown”.
The time-loss of illness and injuries are presented in Figure 6A and B respectively. Overall, illnesses contributed to 3 weeks of total time-loss, 21 weeks of modified time-loss, and 7 weeks of non-time-loss. Injuries contributed to 2 weeks of total time-loss, 23 weeks of modified time-loss, and 5 weeks of non-time-loss.
 |
Figure 6 Health problems by type and the number of weeks of time-loss (A) Illnesses and (B) Injuries.
|
There was evidence of a relationship between maturity offset and total health problem severity (Bmaturity offset (log) = 0.23, [95% HDI = 0.01, 0.46], PD = 0.98), whereby estimated severity increased by 25% (e0.23–1) for every 1-year increase in maturity offset. Further, there was evidence that males typically had higher total severity compared to females (Bmale (log) = 0.52, [95% HDI = −0.33, 1.28], PD = 0.90) by 68% (e0.52–1) (Figure 7).
 |
Figure 7 Relationship between maturity offset (CA minus APHV) and total severity of health problems. Navy and yellow points represent observed values for individual participants. The pink line and ribbon show estimated marginal means and 95% credible intervals for total severity.
|
Training Load
Descriptive statistics for training load can be found in Table 3. Additional data are provided in Supplementary File Table 2.
When athletes were fully participating in training without health problems, reported weekly training load for the swim was 24% higher than the bike (Bbike (log) = −0.28, 95% HDI = [−0.46, −0.10], PD = 0.99), 44% higher than the run (Brun (log) = −0.58, 95% HDI = [−0.76, −0.40], PD = 1.00), and 38% higher than “other” disciplines (Bother (log) = −0.49, 95% HDI =[−0.69, −0.30], PD = 1.00) (Figure 8). There was evidence that training load was lower among older athletes compared to younger athletes (by 9% per year) (Bage (log) = −0.09, 95% HDI =[−0.69, −0.30], PD = 1.00). There was weak evidence that training load declined when athletes reported “reduced participation due to a health problem” (Breduced participation (log) = −0.09, 95% HDI =[−0.38, 0.21], PD = 0.73), with the exception of the run (Breduced participation x run (log) = −0.57, 95% HDI =[−0.98, −0.15], PD = 0.99), which was reduced by 48%. There was no evidence of a difference in training load between females and males (Bmale (log) = −0.07, 95% HDI =[−0.40, 0.24], PD = 0.67).
 |
Figure 8 Relationship between chronological age (CA) and weekly training load according to discipline (swim, bike, run, other) and participation. Points represent observed participant mean values, and lines and ribbons represent estimated marginal means and 95% credible intervals. Other includes race simulation sessions, competitions, and other sport training.
|
Discussion
This study aimed to explore the athletic health history, growth and maturation and current health status of youth triathletes prior to entry into the NIN, and to examine the associations between growth, training load and health problem severity. Key findings across the three focus areas revealed slightly later PHV in both sexes compared to population norms and other sports, with males demonstrating accelerated arm span growth over females ahead of height stature increases. Health problems were frequently reported, with illness having greater total time-loss than injury, and severity increased in athletes beyond PHV (particularly males). Additionally, training load imbalances occurred across the three disciplines relative to race distances and injury profiles.
Growth and Maturation
Female triathletes was estimated as occurring at 12.5–12.6 years, slightly later than the general population (12 years)39 and female athletes involved in team and individual sports (11.8 years).40 Male triathletes PHV was estimated at 13.3–14.0 years, compared to 13.1 years in young male athletes,41 primarily European footballers. Other studies report PHV at 14.4, 12.9 and 12.7 in soccer and tennis players, respectively.42–44
In the present study, male athletes demonstrated an average arm span growth tempo of 0.51 ± 0.35 cm per month from Time point 2 to Time point 3, with individual values reaching up to 1.02 cm per month, suggesting accelerated limb growth during our monitoring period, but prior to stretch stature growth (Figures 4 and 5). This pattern is consistent with existing adolescent growth and maturation literature which describes a distal-to -proximal growth sequence, whereby limbs grow before the trunk.45,46
In the context of triathlon, this is particularly relevant for the swim discipline, where arm span contributes significantly to stroke mechanics and propulsion.47 Sudden changes in upper limb length may temporarily disrupt technique or outpace neuromuscular adaptations, potentially impairing performance and increasing the risk of musculoskeletal strain. Similarly, rapid changes in upper body dimensions can compromise bike fit, reducing handling efficiency and contributing to compensatory movement patterns, particularly in the neck and shoulders. Potentially elevating the risk of overuse injuries or contributing to reduced stability and increased crash risk. Monitoring arm span tempo presents a practical, non-invasive method to inform training modifications, equipment adjustments, and injury prevention strategies during key phases of adolescent triathlon growth and development.
Males showed a greater increase in BA offset (0.45 years) with CA than females, and an overall higher number of illnesses and injuries than females. This suggests the importance of sex- and maturity-specific training, including consideration of discipline type (weight bearing vs non-weight bearing) in terms of less mature tissues on similar training loads.
Female athlete health data indicated a later average age of menarche (13.7 years) in triathletes, aligning with findings from Anjos et al48 who reported delayed menarche in athletes participating in sports such as soccer, gymnastics and triathlon (median age triathlon: 13 years). Noting the female participants in our study also had athletic histories of soccer and gymnastics (Table 1). Several athletes in our study also reported ongoing menstrual irregularities, dysmenorrhea, and tiredness, symptoms commonly associated with low energy availability. Low energy availability has been linked to impaired bone mineral accrual, delayed recovery and increased injury risk in endurance sports,48,49 thus longer-term monitoring of total weekly training load along with menstrual cycle patterns could help inform timely nutritional and training prescription in young female athletes.
Health Problems
Illness was reported more frequently than injury during the 10-week monitoring period (22 vs 14 cases), with respiratory illnesses comprising the majority of reports. This illness prevalence aligns with previous findings in short course triathletes and other endurance athletes, where high-intensity training has been associated with transient immunosuppression and increased susceptibility to infections.9,50 Notably, seven athletes experienced both injury and illness within the same period, suggesting a potential cyclical relationship driven by cumulative fatigue, inadequate recovery, and a combination of external (eg academic demands, family, life commitments) and internal (training load, growth, early season performance anxiety) stressors. This cycle may have been further exacerbated by minimal reductions in training load during health problems, except for running sessions.51
Health problems were also monitored over a 10-week period starting in Spring (September/October) in Australia corresponding to the start of the triathlon season, when athletes were building training volume and intensity. In addition, the timing of monitoring during Spring may have presented seasonal challenges, such as rising temperatures, humidity, and allergens, potentially contributing to injury and illness risk. These observations highlight the impact of both illness and injury on training consistency and the need for recovery focused strategies, including adequate nutrition, sleep and work-load management supporting athlete health and performance.52
The injury profile observed was predominantly stress-related bone injuries and soft tissue strains, primarily affecting the lower leg. This injury profile is also consistent with other youth endurance sports and studies involving elite triathletes.9,19,53 The severity of health problems appeared to increase in triathletes with a higher maturity offset (ie, greater than ~2.5). This observation also agrees with previous research demonstrating a higher injury prevalence following PHV, characterised by greater training time loss22,54 Two male athletes and one female athlete who all had previous growth-related injuries and/or bone injuries (Table 1) reported lower leg, knee, and lumbar pain as well as lower leg bone stress injuries during the 10-week study. Although we do not know the exact time frame (years) from previous injuries (Table 1) to current injuries (Figure 6) it may independently contribute to injury risk (since previous injury is a strong risk factor for a new injury).55,56
Training Load
There were notable differences in training loads across the swim, bike, run, and “other” disciplines among youth triathletes. Interestingly, the swim discipline consistently had the highest total weekly training load, averaging 24% more than the bike, 44% more than the run, and 38% more than “other” activities. These lower training loads in the run discipline may also be a contributing factor to the higher incidence of bone stress injuries observed in the male youth triathletes.57 Research indicates that insufficient loading of developing bones can lead to increased risk of stress fractures and other overuse injuries. Therefore, the combination of lower run training volumes but higher intensity sessions in the run discipline, and “other” may place undue stress on later maturing male triathletes lower limbs and insufficient bone remodelling time.58 Similar patterns have been observed in distance running where overuse injuries were common, particularly in the lower extremities, and were often linked to training loads that were either too high or improperly managed.59 Thus, the importance of balanced training loads and the earlier implementation of consistent strength and conditioning sessions inclusive of plyometric and proprioceptive exercises may mitigate these bone stress and lower body injury risks on developing athletes.59–61
Additionally, higher swim volume has also been seen as an increased risk of running-related injuries.62 The senior female athletes weekly swim load was the highest across the whole cohort, they also had the lowest weekly run load. This could be a potential risk factor for injury or pain due to lack of a protective fitness response, even allowing for their biological advancement in bone age.7
Limitations
This study has several limitations that should be acknowledged. First, the use of non-invasive maturity prediction equations such as the Mirwald method,28 while practical for sport and widely used in sport research settings, may be less accurate in individuals who mature significantly earlier or later than average, potentially affecting the interpretation of growth-related findings.63 Similarly, the bone age prediction equation used (Cabral et al)31 may have limitations in precision in comparison to imaging techniques. The sample size was relatively small, with varying participation across data points, 53 athletes were included in the study, but 34 athletes completed the health problems questionnaire and training load monitoring, while 27 completed the athletic health questionnaire which may introduce selection and attrition bias and limit the reliability of certain comparisons in growth.
Seven injuries remained unclassified, which may reflect underreporting or limited communication between athletes and coaches, a well-documented challenge in youth sport settings.64 Additionally, the 10-week monitoring period for health problems and training load may limit the generalization of these findings to longer term trends and this should be considered when interpreting the results.
Practical Considerations/Summary
These key findings (Table 4) suggest the need for long-term monitoring frameworks that respond to individual growth and maturation patterns rather than chronological age alone. Integrating health surveillance, training load balance, musculoskeletal capacity and sex-specific indicators can help guide safer, more sustainable athlete development across multiple seasons.
 |
Table 4 Key Findings
|
Future research should further investigate these sex-specific differences during growth and maturation, including menstrual health, using longer term longitudinal tracking. Developing a more comprehensive understanding of how youth triathletes respond to discipline-specific training loads, recovery and nutritional intake will help strengthen athlete management approaches aimed at supporting musculoskeletal adaptation through growth and maturation while reducing health problem risk. In addition, education for coaches and performance staff will be needed to ensure these insights are effectively translated into practice.
Conclusions
Youth triathletes showed later peak height velocity than population norms and advanced predicted bone age relative to chronological age. Severity of health problems was greater among athletes’ post-peak height velocity with males showing higher severity of health problems than females. Illness was reported more frequently than injuries, with greater total time-loss, and several athletes reported both injury and illness concurrently. Most injuries were to the lower limb despite swimming having higher weekly training load volume and running the lowest training load volume. The findings suggest the need for individualized, longitudinal monitoring in youth triathlon pathways, indicating the importance of tracking growth and maturation, alongside balanced discipline and sex-specific training load prescription to support long-term performance progression and transition to the NIN and sustained elite-level competition.
Acknowledgments
We would like to thank the athletes and their parents/guardians for their participation in the study. Thank you to coach education and state pathway lead Robyn Low-Hart and all AusTri coaches involved for their support throughout the study. We also acknowledge Stephen MacGabhann (NSWIS/UCRISE) and Rebecca Haslam (NSWIS) for their assistance during this study.
Author Contributions
All authors made a significant contribution to the work reported, whether that is in the conception, study design, execution, acquisition of data, analysis and interpretation, or in all these areas; took part in drafting, revising or critically reviewing the article; gave final approval of the version to be published; have agreed on the journal to which the article has been submitted; and agree to be accountable for all aspects of the work.
Funding
AF was supported by a PhD Industry scholarship between New South Wales Institute of Sport and the University of Canberra.
Disclosure
Dr Gordon Waddington is a Shareholder of Prism Neuro Pty Ltd, outside the submitted work. No potential conflict of interest was reported by the authors.
References
1. Sharma AP, Périard JD. Physiological requirements of the different distances of triathlon. In: Migliorini S, editor. Triathlon Medicine. Springer International Publishing; 2020:5–17.
2. García-Giménez A. Triathlon performance: physiological and training strategies from super sprint to long distance events. Fizicko vaspitanje i sport kroz vekove. 2024;11:87–93. doi:10.5937/spes2402087g
3. Martínez-Sobrino J, Del Cerro JS, González-Ravé JM, Veiga S. Race dynamics in triathlon mixed-team-relay meaningfully changes with the new regulation towards Paris 2024. J Sports Sci Med. 2024;23(2):358–365. doi:10.52082/jssm.2024.358
4. Etxebarria N, Mujika I, Pyne DB. Training and competition readiness in triathlon. Sports. 2019;7(5):101. doi:10.3390/sports7050101
5. Eckard TG, Padua DA, Hearn DW, Pexa BS, Frank BS. The relationship between training load and injury in athletes: a systematic review. Sports Med. 2018;48(8):1929–1961. doi:10.1007/s40279-018-0951-z
6. Plews DJ, Laursen PB, Kilding AE, Buchheit M. Heart rate variability in elite triathletes, is variation in variability the key to effective training? A case comparison. Eur J Appl Physiol. 2012;112(11):3729–3741. doi:10.1007/s00421-012-2354-4
7. Johnston R, Cahalan R, O’Keeffe M, O’Sullivan K, O’Sullivan K, Comyns T. The associations between training load and baseline characteristics on musculoskeletal injury and pain in endurance sport populations: a systematic review. J Sci Med Sport. 2018;21(9):910–918. doi:10.1016/j.jsams.2018.03.001
8. Meeusen R, Duclos M, Gleeson M, Rietjens G, Steinacker J, Urhausen A. Prevention, diagnosis and treatment of the Overtraining Syndrome. Eur J Sport Sci. 2006;6(1):1–14. doi:10.1080/17461390600617717
9. Guevara S, Crunkhorn M, Drew M, et al. Injury and illness in short-course triathletes: a systematic review. J Sport Health Sci. 2023;13:172–185. doi:10.1016/j.jshs.2023.03.002
10. Bales J, Bales K. Swimming overuse injuries associated with triathlon training. Sports Med Arthrosc Rev. 2012;20(4):196–199. doi:10.1097/JSA.0b013e318261093b
11. Ambrosini L, Presta V, Galli D, et al. Interlink between physiological and biomechanical changes in the swim-to-cycle transition in triathlon events: a narrative review. Sports Med- Open. 2022;8(1):129. doi:10.1186/s40798-022-00521-z
12. Manninen JS, Kallinen M. Low back pain and other overuse injuries in a group of Japanese triathletes. Br J Sports Med. 1996;30(2):134–139. doi:10.1136/bjsm.30.2.134
13. Migliorini S. Risk factors and injury mechanism in triathlon. J Human Sport Exercise. 2011;6:309–314. doi:10.4100/jhse.2011.62.11
14. Etxebarria N, D’Auria S, Anson J, Pyne D, Ferguson R. Variability in power output during cycling in international Olympic-distance triathlon. Int J Sports Physiol Performance. 2014;9(4):732–734. doi:10.1123/ijspp.2013-0303
15. Hotfiel T, Mayer I, Huettel M, et al. Accelerating recovery from exercise-induced muscle injuries in triathletes: considerations for Olympic distance races. Sports. 2019;7:143. doi:10.3390/sports7060143
16. Minghelli B, Jesus C, Martins I, Jesus J. Triathlon-related musculoskeletal injuries: a study on a Portuguese Triathlon Championship. Revista da Associacao Medica Brasileira. 2020;66(11):1536–1541. doi:10.1590/1806-9282.66.11.1536
17. Espejo R, Martínez-Sobrino J, Veiga S. Competitive demands during international sprint-distance triathlon races according to the course type: the influence of cycling on subsequent running performance. Sports Med- Open. 2025;11. doi:10.1186/s40798-025-00828-7
18. Gil-Caselles L, Barquín RR, Gimenez-Egido JM, García-Naveira A, Olmedilla A. A perfectionism, mental health and vulnerability to injury in triathletes. Front Psychol. 2025;16. doi:10.3389/fpsyg.2025.1561432
19. Crunkhorn ML, Toohey LA, Charlton P, Drew M, Watson K, Etxebarria N. Injury incidence and prevalence in elite short-course triathletes: a 4-year prospective study. Br J Sports Med. 2024;58(9):470. doi:10.1136/bjsports-2023-107327
20. Drew MK, Raysmith BP, Charlton PC. Injuries impair the chance of successful performance by sportspeople: a systematic review. Br J Sports Med. 2017;51(16):1209–1214. doi:10.1136/bjsports-2016-096731
21. Brenner JS, Watson A. Medicine Cos, Fitness. Overuse injuries, overtraining, and burnout in young athletes. Pediatrics. 2024;153(2). doi:10.1542/peds.2023-065129
22. Parry GN, Williams S, McKay CD, Johnson DJ, Bergeron MF, Cumming SP. Associations between growth, maturation and injury in youth athletes engaged in elite pathways: a scoping review. Br J Sports Med. 2024;58(17):1001–1010. doi:10.1136/bjsports-2024-108233
23. Malina RM. Physical growth and biological maturation of young athletes. Exer Sport Sci Rev. 1994;22(1):280–284. doi:10.1249/00003677-199401000-00012
24. Beunen G, Thomis M, Maes HH, et al. Genetic variance of adolescent growth in stature. Ann Hum Biol. 2000;27(2):173–186. doi:10.1080/030144600282280
25. Malina RM, Rogol AD, Cumming S, Coelho-e-Silva MJ, Figueirido AJ. Biological maturation of youth athletes: assessment and implications. Br J Sports Med. 2015;49(13):852–859. doi:10.1136/bjsports-2015-094623
26. Quatman-Yates CC, Quatman CE, Meszaros AJ, Paterno MV, Hewett TE. A systematic review of sensorimotor function during adolescence: a developmental stage of increased motor awkwardness? Br J Sports Med. 2012;46(9):649–655. doi:10.1136/bjsm.2010.079616
27. Wik EH, Martínez-Silván D, Farooq A, Cardinale M, Johnson A, Bahr R. Skeletal maturation and growth rates are related to bone and growth plate injuries in adolescent athletics. Scand J Med Sci Sports. 2020;30(5):894–903. doi:10.1111/sms.13635
28. Mirwald R, Baxter-Jones A, Bailey D, Beunen G. An assessment of maturity from anthropometric measurements. Med Sci Sports Exercise. 2002;34(4):689–694. doi:10.1097/00005768-200204000-00020
29. von Elm E, Altman DG, Egger M, Pocock SJ, Gøtzsche PC, Vandenbroucke JP. Strengthening the reporting of observational studies in epidemiology (STROBE) statement: guidelines for reporting observational studies. BMJ. 2007;335(7624):806–808. doi:10.1136/bmj.39335.541782.AD
30. Silva VSD, Vieira MFS. International Society for the Advancement of Kinanthropometry (ISAK) Global: international accreditation scheme of the competent anthropometrist. Revista Brasileira de Cineantropometria Desempenho Humano. 2020;22:e70517.
31. Cabral B, Cabral S, Vital R, et al. Prediction equation of bone age in sports initiation through anthropometric variables. Revista Brasileira de Medicina do Esporte. 2013;19:99–103. doi:10.1590/S1517-86922013000200005
32. Towlson C, Salter J, Ade JD, et al. Maturity-associated considerations for training load, injury risk, and physical performance in youth soccer: one size does not fit all. J Sport Health Sci. 2021;10(4):403–412. doi:10.1016/j.jshs.2020.09.003
33. Khamis HJ, Roche AF. Predicting adult stature without using skeletal age: the Khamis-Roche Method. Pediatrics. 1994;94(4):504–507. doi:10.1542/peds.94.4.504
34. Clarsen B, Bahr R, Myklebust G, et al. Improved reporting of overuse injuries and health problems in sport: an update of the Oslo sport trauma research center questionnaires. Br J Sports Med. 2020;54(7):390–396. doi:10.1136/bjsports-2019-101337
35. Bailón-Cerezo J, Clarsen B, Sánchez-Sánchez B, Torres-Lacomba M. Cross-cultural adaptation and validation of the oslo sports trauma research center questionnaires on overuse injury and health problems (2nd Version) in Spanish Youth Sports. Orthop J Sports Med. 2020;8(12):2325967120968552. doi:10.1177/2325967120968552
36. Haddad M, Stylianides G, Djaoui L, D A, Chamari K. Session-RPE method for training load monitoring: validity, ecological usefulness, and influencing factors. Front Neurosci. 2017;11:612. doi:10.3389/fnins.2017.00612
37. Bürkner P-C. brms: An R Package for Bayesian multilevel models using Stan. J Statistic Software. 2017;80(1):1–28. doi:10.18637/jss.v080.i01
38. Makowski D, Ben-Shachar M, Lüdecke D. bayestestR: describing effects and their uncertainty, existence and significance within the Bayesian framework. J Open Source Software. 2019;4(40):1541. doi:10.21105/joss.01541
39. Beunen GP, Malina RM, Renson R, Simons JAN, Ostyn M, Lefevre J. Physical activity and growth, maturation and performance: a longitudinal study. Med Sci Sports Exercise. 1992;24(5):576–585. doi:10.1249/00005768-199205000-00012
40. Lima A, Quinaud R, Karasiak F, Galvão L, Gonçalves C, Carvalho H. Longitudinal meta-analysis of peak height velocity in young female athletes. Cureus. 2024;16. doi:10.7759/cureus.59482
41. Lima A, Quinaud R, Gonçalves C, Carvalho H. Peak height velocity in young athletes: a longitudinal meta-analysis. J Sports Sci. 2023;41:151–163. doi:10.1080/02640414.2023.2203484
42. Bult HJ, Barendrecht M, Tak I. Injury risk and injury burden are related to age group and peak height velocity among talented male youth soccer players. Orthop J Sports Med. 2018;6. doi:10.1177/2325967118811042
43. Carvalho H, Lekue J, Gil S, Bidaurrazaga-Letona I. Pubertal development of body size and soccer-specific functional capacities in adolescent players. Res Sports Med. 2017;25:421–436. doi:10.1080/15438627.2017.1365301
44. Fernández-Fernández J, Canós-Portalés J, Martínez-Gallego R, Corbi F, Baiget E. Effects of maturation on lower-body neuromuscular performance in youth tennis players. J Strength Conditioning Res. 2021;37:167–173. doi:10.1519/JSC.0000000000004187
45. Bradney M, Karlsson MK, Duan Y, Stuckey S, Bass S, Seeman E. Heterogeneity in the growth of the axial and appendicular skeleton in boys: implications for the pathogenesis of bone fragility in men. J Bone Miner Res. 2000;15(10):1871–1878. doi:10.1359/jbmr.2000.15.10.1871
46. Bass S, Delmas PD, Pearce G, Hendrich E, Tabensky A, Seeman E. The differing tempo of growth in bone size, mass, and density in girls is region-specific. J Clin Invest. 1999;104(6):795–804. doi:10.1172/JCI7060
47. Oliveira M, Henrique R, Queiroz D, Salvina M, Melo W, Santos MAMD. Anthropometric variables, propulsive force and biological maturation: a mediation analysis in young swimmers. Eur J Sport Sci. 2020;21:507–514. doi:10.1080/17461391.2020.1754468
48. Anjos MM, Braga C, Cruz-Ferreira AM. Impact of sports on female growth and pubertal development: a cohort study. Cureus. 2024;16(12):e75805. doi:10.7759/cureus.75805
49. Thein-Nissenbaum JM, Rauh MJ, Carr KE, Loud KJ, McGuine TA. Menstrual irregularity and musculoskeletal injury in female high school athletes. J Athletic Training. 2012;47(1):74–82. doi:10.4085/1062-6050-47.1.74
50. Moreira A, Delgado L, Moreira P, Haahtela T. Does exercise increase the risk of upper respiratory tract infections? Br Med Bul. 2009;90(1):111–131. doi:10.1093/bmb/ldp010
51. Jones CM, Griffiths PC, Mellalieu SD. Training load and fatigue marker associations with injury and illness: a systematic review of longitudinal studies. Sports Med. 2017;47(5):943–974. doi:10.1007/s40279-016-0619-5
52. Herring SA, Ben Kibler W, Putukian M, et al. Load, overload, and recovery in the athlete: select issues for the team physician-A consensus statement. Curr Sports Med Rep. 2019;18(4):141–148.
53. Martínez-Silván D, Díaz-Ocejo J, Murray A. Predictive indicators of overuse injuries in adolescent endurance athletes. Int J Sports Physiol Performance. 2017;12(s2):S2–153–S2–156. doi:10.1123/ijspp.2016-0316
54. Monasterio X, Gil SM, Bidaurrazaga-Letona I, et al. Injuries according to the percentage of adult height in an elite soccer academy. J Sci Med Sport. 2021;24(3):218–223. doi:10.1016/j.jsams.2020.08.004
55. Hägglund M, Waldén M, Ekstrand J. Previous injury as a risk factor for injury in elite football: a prospective study over two consecutive seasons. Br J Sports Med. 2006;40(9):767. doi:10.1136/bjsm.2006.026609
56. von Rosen P, Heijne A. Previous and current injury and not training and competition factors were associated with future injury prevalence across a season in adolescent elite athletes. Physiother Theory Pract. 2022;38(3):448–455. doi:10.1080/09593985.2020.1762266
57. Brenner JS, Watson A, Brooks MA, et al. Overuse injuries, overtraining, and burnout in young athletes. Pediatrics. 2024;153(2). doi:10.1542/peds.2023-065129
58. Scofield KL, Hecht S. Bone health in endurance athletes: runners, cyclists, and swimmers. Curr Sports Med Rep. 2012;11(6):328–334. doi:10.1249/jsr.0b013e3182779193
59. Mann RH. Health and well-being in competitive adolescent distance runners: health problems, training load and psychosocial responses to injury (PhD Academy Award). Br J Sports Med. 2023;57(16):1061–1062. doi:10.1136/bjsports-2022-106608
60. Vlachopoulos D, Barker A, Williams C, Knapp K, Metcalf B, Gracia-Marco L. Effect of a program of short bouts of exercise on bone health in adolescents involved in different sports: the pro-bone study protocol. BMC Public Health. 2015;15. doi:10.1186/s12889-015-1633-5
61. Vlachopoulos D, Ubago-Guisado E, Barker AR, et al. Determinants of bone outcomes in adolescent athletes at baseline: the pro-bone study. Med Sci Sports Exercise. 2017;49(7):1385–1392. doi:10.1249/mss.0000000000001233
62. Vleck VE, Garbutt G. Injury and training characteristics of male elite, development squad, and club triathletes. Int J Sports Sci Med. 1998;19(01):38–42. doi:10.1055/s-2007-971877
63. Monasterio X, Cumming S, Larruskain J, et al. The combined effects of growth and maturity status on injury risk in an elite football academy. Biol Sport. 2024;41(1):235–244. doi:10.5114/biolsport.2024.129472
64. Clarsen B, Myklebust G, Bahr R. Development and validation of a new method for the registration of overuse injuries in sports injury epidemiology: the Oslo Sports Trauma Research Centre (OSTRC) overuse injury questionnaire. Br J Sports Med. 2013;47(8):495–502. doi:10.1136/bjsports-2012-091524

Jan. 5, 2026, 4:02 a.m. ET
One of the toughest transitions for basketball players can be from the youth level to high school varsity. Each season, however, a group of freshmen not only make the transition, but they impact their new team right away.
This winter, there have again been both boys and girls freshmen scoring for their varsity teams and earning starting spots throughout District 10.
Here is a list of 15 freshmen making an impact through the first half of the season.
Fans can vote for their choice as the District 10 Breakout Freshman of the Year at the midway point of the season through Thursday at noon.
Kris Blue, Farrell – Blue has emerged as a leader for the Steelers and is a big reason why Farrell could compete for a D-10 girls basketball title. She is averaging 11.2 points per game as a perfect complement to 1,000-point scorer Janiya Daniels.
Kenlyn Masters, Sharpsville – The Blue Devils had a strong girls basketball team back this winter and Masters is adding to the depth. She is scoring 10.8 points per game and is on her way to a big career at Sharpsville.
Kymani Vine, Eisenhower – The big story around the Knights was the consolidation with Youngsville, but Vine has been a story as well. He is averaging 16.5 points per game as a dominant forward for the Knights.
Alba Potter, McDowell – There was plenty of hype around Potter coming into the season after a big offseason on the AAU circuit. She is not only scoring 10.4 points per game for the Trojans but she is also a top 3-point shooter in D-10 with 22 makes on the season so far.
Madison Mallek, Greenville – The forward has added depth to the Trojans’ inside game this season. She is scoring 9.3 points per game and is a tough rebounder as well.
Nolan Golub, West Middlesex – The quick point guard is a staple for the Big Reds this season. He is scoring 12.9 points per game while running the offense as well.
Leah Nies, Cathedral Prep – Nies is another freshman that had a lot of hype surrounding her. The speedy guard has responded with 8.6 points per game and is a threat from the 3-point line as well.
Riley Coblentz, Iroquois – The youth movement is going on at Iroquois, and Coblentz is scoring 8.5 points per game and emerging as a leader for Iroquois.
Jhytarion Moffett, Meadville – Moffett is part of a youth movement for the Bulldogs. He is averaging 5 points per game and has played in every game this season to add depth for Meadville.
Mia Washburn, Cathedral Prep – It’s not common practice to have two athletes from the same team on the same poll, but Washburn is also having a big freshman season for the Ramblers. She is also averaging 8.6 points per game and is a threat from the 3-point line.
Abbigail Walmer, Cambridge Springs – The Blue Devils are rebuilding the program and Walmer is leading the way. She is averaging 7.6 points per game and has knocked down 20 3-pointers this season.
Kyjuan Campbell, Farrell – With a loaded team back this winter, Campbell has forced his way into playing time with solid contributions for the Steelers. He is scoring 5 points per game off the bench.
Ella Thompson, Harbor Creek – Thompson is in the next wave of impressive forwards in Erie County as she is a solid scorer and talented rebounder. She is averaging 7.6 points per game.
Talia Bianconi, Grove City – Bianconi has picked up the slack with the Eagles losing standout Maddie Osborn for the season to injury. Bianconi is scoring 7.4 points per game to give Grove City another scoring option.
Liam Hanson, Eisenhower – Hanson is another standout freshman for the Knights. He is scoring 11.5 points per game and is on his way to a big career for Eisenhower.
Contact Tom Reisenweber at treisenweber@timesnews.com. Follow him on X @ETNreisenweber.
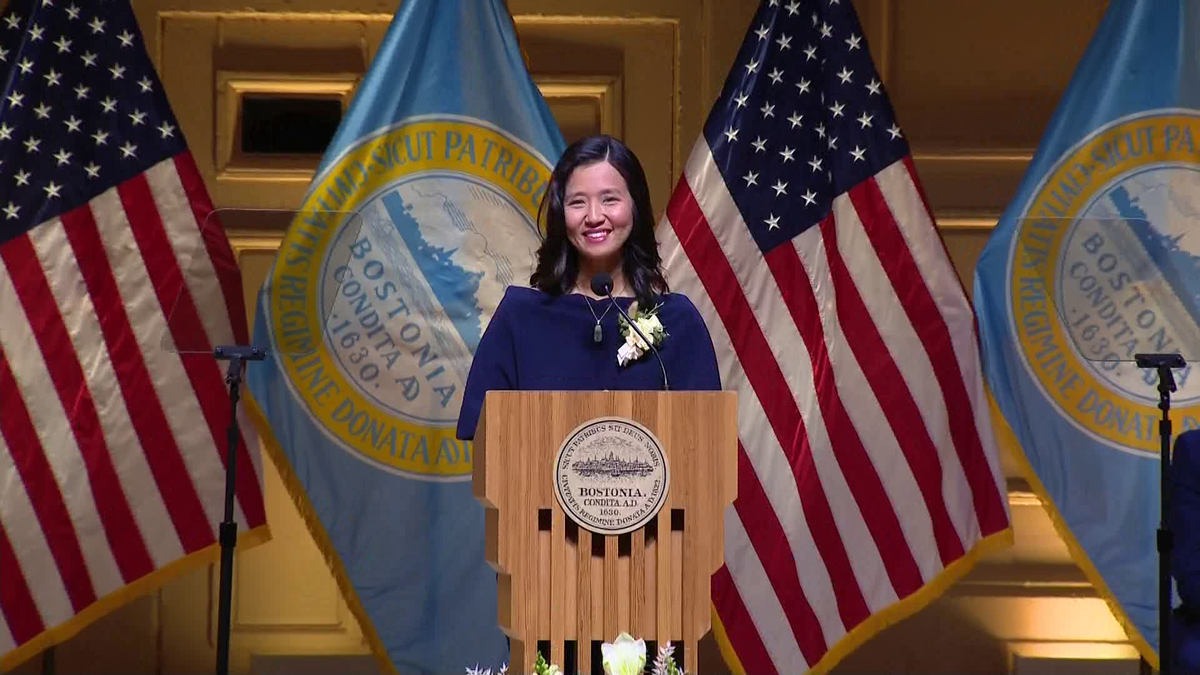
Good morning Boston, and Happy New Year! Congratulations to the Boston City Council, and a special welcome to our colleague, new to elected office—but not new to service—Reverend Councilor Miniard Culpepper.To all our Councilors: Thank you for your faith in our city and your dedication to service as we strive to uphold the values on which our nation was founded. When you take your oath of office in the most acoustically perfect concert hall in America, the words ring with a special weight.Boston Symphony Hall was the first concert hall in the world to be designed by renowned architects and a Harvard physics professor—who invented a formula to design this space with the perfect reverberation time: 1.9 seconds. Every angle and every surface, every statue tucked in every nook, reflects that uniquely Boston blend of science and the arts to serve the public good.Thank you to our hosts at the BSO for sharing this beautiful venue with us, and for opening your doors to all the children of Boston as partners in our Boston Family Days program.Video: ‘Threw down the gauntlet’: BU professor unpacks Wu’s inaugural speechGovernor Healey, Congresswoman Pressley, Congressman Auchincloss, Chairman Michlewitz, Leader Moran and Ellie, to my fellow mayors here today, and all of our state, county, and federal officials: Thank you for your partnership.To our City workers, thank you for making everything we do possible. To my husband Conor; to Blaise, Cass, Mira, and my entire family—I love you so much. And to the people of Boston: Thank you for the honor of continuing our work together. Thank you for choosing to be a city that doesn’t settle or fold…for believing that a better world is possible, and working together to build it no matter what stands in our way. 2026 marks four years and two months since our administration took office—and 250 years since our nation was born. 250 years ago on this very day, a young man—the son of immigrants, and a BPS alum—was standing on the banks of a half-frozen river, focused on getting home to Boston.Henry Knox was on a mission to bring cannons from Fort Ticonderoga—over 300 miles—to Dorchester Heights, where…with command of the high ground, General George Washington and the patriots could liberate Boston from British control. But between Knox and his city lay a nearly impossible obstacle for 60 tons of cannons to cross: The Hudson River, thawing in the sun, its surface a mosaic of splintering ice.Without the cannons, he knew Boston would never be free. Without Boston, he knew the revolution would fail. So, over the next few days, Knox and his men crept out onto the ice in the coldest part of the night, drilling holes to let the water flow up from below and freeze over in thickening layers.Faced with an impossible challenge, he did what Boston has always done best: With a blend of creativity and courage, imagination and will, he forged a path forward.Four years ago, I was sworn in as mayor in the only building in Boston more beautiful than this one: City Hall. It was a small gathering, everyone was masked, and it felt—at the time—like we might never emerge from the endless cycle of constantly-evolving viruses threatening to keep us apart.Still, we had hope.Because in Boston, we know obstacles are opportunities to go beyond old ways of thinking—to innovate and set a new standard for the world to meet. For nearly four centuries, Boston has been the center of American innovation and progress: The place where revolutionary ideas get their start, where the impossible is overcome with creativity and courage, imagination and will.So, four years ago, we got to work forging the path forward.We promised to make Boston a home for everyone, starting with safety; and together, we drove gun violence down to the lowest levels on record. We refused to accept the broken status quo at Mass and Cass, coordinating a citywide response to permanently end encampments and connect thousands of people to recovery.We prioritized housing like never before, building 4,200 affordable homes with another 2,000 under construction, tackling outdated zoning and red tape, converting vacant City lots and empty office buildings into hundreds of new homes, and helping more Boston families become first-time homeowners than ever before.We expanded Boston pre-K to serve 5,000 families and helped 200 new childcare providers open their doors to our littlest learners. We taught more than 20,000 kids how to swim and ride bikes; expanded youth sports citywide; and made museums and performances free for every Boston kid and their family. Boston Public Schools graduation rates and attendance are up, and we’re on track to offer early college classes to every high school student by fall of 2028.We saved residents and businesses more than $230 million dollars on energy bills, cut our retail vacancy rate nearly in half compared to two years ago, and made three bus routes fare-free. We repaved more than 100 miles of roadway, made it faster to fix sidewalks, and protected more miles of road for safe walking and biking than ever before.We’ve seen how much is possible because of how far we’ve pushed forward, together. And we need to keep pushing.Because, right now, in some ways, the world feels helplessly stuck—like we know what problems need fixing, but we’ve lost faith we can fix them. Today, the forces we face aren’t British troops on the Common or ships in our harbor, but they demand no less ingenuity.Isolation, polarization, and misinformation are fraying our connection to trust, truth, and each other. Core industries are losing workers to competitors overseas. Against this backdrop the federal government is taking aim at the ways we take care of each other: They have slashed funding for emergency management, research, housing, education, and life-saving care; abducted our neighbors off sidewalks and outside our schools; crushed small businesses with trade wars and tariffs; trashed clean energy projects to profit billionaire donors; carried out unconstitutional military campaigns; and illegally deployed our troops against their own families and neighbors in peaceful American cities.This federal administration has plundered our economy, ravaged our reputation, torched our institutions, and destroyed the lives of our people. But, when in the course of human events, it becomes necessary for a city to stand as the beacon for freedom and proof of what’s possible—a testament to the endurance of American ingenuity and civic success, Boston will be that beacon. We will not appease or abet any threat to our city, and we will not wait for permission to build the world our families deserve. Over the next four years, Boston will be the proof that the nation we fought for is possible—a place where we take care of each other and take on the challenges that matter the most. In our second term, we will reinforce the very foundations of our democracy: local government as the bedrock for getting results.Making Boston the best city for families means getting the basics right and delivering on our most fundamental, most important work every day. Repaving streets and sidewalks, tending to our playgrounds and parks, and ensuring that every block of our city is healthy and safe, beautiful and welcoming for every one of our residents.Nearly a century and a half before our nation was born, Bostonians were hosting town meetings to tackle together the challenges they couldn’t tackle alone. Our public parks, our schools, and our libraries were the first in the country because Boston was determined to be a democracy that’s direct and effective, focused unflinchingly on the public good.This legacy lives on in every pothole filled, every library book borrowed, every playground filled with laughter. We will continue to make city services more efficient, responsive, and accessible in every way possible, across every neighborhood.Starting this year, together with members of my Cabinet and the Office of Neighborhood Services, we will hold Mayor’s Office Hours across Boston: An opportunity to connect directly with residents, hear what’s working and what’s not, and unstick any city service issues in real time.And, to ensure that every community member can count on City Hall, whether you’re opening a business, throwing a block party, or building a home—we’re going to streamline every city permitting process and set the bar for excellence in constituent services.In this second term, on that foundation of excellence, we will build the country’s oldest public school district into the best—so that BPS is the first choice for all of our families.Two miles from here, Boston opened the first public school in the country—the same school where Henry Knox learned to read. Two hundred years before the rest of the nation, we made a choice to make education a right. Today, we also choose operational excellence, academic rigor, and high expectations in every classroom.We’ll continue rightsizing our district, investing in facilities and student supports, and improving transportation. We refuse to accept that accessing high quality education means crisscrossing our children all over our city rather than ensuring that, in every corner of Boston, the best school is just down the block.We will revisit school assignment to be simpler and more predictable, reduce time students spend on the bus, and reinvest in advanced coursework, arts, and athletics. And because learning shouldn’t be confined to the first and last bell, with our community partners, we will offer quality before- and after-school programming available and accessible at every BPS school by the start of the 2027 school year.And we will invest in the facilities our students and families deserve. Just last month, the Massachusetts School Building Authority selected BPS to start the process for a full rebuild at Madison Park Technical Vocational High School. And next year, we’ll cut the ribbon on the best student athletics facility of any public school district in the country at Boston’s own White Stadium.With partnerships across every sector of the city focused on our schools, we will build reliable pathways to student success and make it our mission to get every last detail right for our BPS communities.An educated citizenry is the lifeblood of Boston’s proud tradition of civic engagement, and the key to our economic success. And in this moment, we must continue to secure our sources of economic prosperity and defend the engines that drive innovation all across America.We will fiercely defend our universities, our hospitals, our life sciences and innovation sector, so they can keep generating the breakthroughs that drive the progress our city is known for and our country needs.We will ensure that Boston remains the place where people come to do good in the world, to solve the toughest problems that haven’t been solved: We will work smarter and harder to recruit the scientists and companies curing diseases like cancer and Alzheimer’s, harness clean energy, and improve lives all over the world.We will partner with higher education and industry to nurture and benefit from the innovation that will reshape the future, from robotics to climate technology. Together, we will prepare workers for emerging technology to expand their opportunities rather than be replaced.We will use our infrastructure investments and purchasing power to make our communities resilient against rising seas and stronger storms, and power our City with cleaner, more affordable energy. We will expand careers in green industries, including the construction trades, building operations, facilities management, stormwater infrastructure, horticulture, and engineering.And for our city to flourish, Bostonians must be able to grow up and grow old here. We will work to address the housing needs of our families and seniors, focusing on solutions they want and can afford. Over the next four years, we will continue inventing new ways to use public planning, public finance, and public land to create the homes our residents need, because we know that housing is a public good.We are the city that created whole new neighborhoods out of swampland and invented the triple-decker to tackle the housing crises of our past. We will not be defeated by the affordability crisis of the present. Together, we will deliver the best city services to all of our residents, set the standard for public education, and build an economy that will thrive for another two-and-a-half centuries.If we can invent America, then we can be the city that forges the path forward in this moment.Right now, backstage, there’s someone who doesn’t know anything about acoustics or walking on ice.In fact, she’s just barely learning to walk. But, here with me this morning on this very stage, she took one wobbly step, then another, then looked up and laughed.They weren’t her very first steps, but they were her first in a little while.Unlike her older brothers, who couldn’t wait to go from wobbling to walking and running, Mira decided that, after taking her first two steps—and a tumble—a month ago, she wasn’t sure she wanted to do it again.But, this morning, on this stage, she chose to try again knowing she might fall.250 years ago, Henry Knox didn’t charge onto the ice of the Hudson. He wrote a letter to Washington explaining the challenge he faced. He took a moment to gather himself and reflect, but he didn’t wait for certainty, either. With creativity and courage, imagination and will, he forged a path and pressed on—knowing the ice might not hold. Mira doesn’t know about Knox, or the physics that explain why her laughter this morning hung in this hall like a bell.She doesn’t know that every March, we celebrate Evacuation Day here in Boston because Knox was creative and brave—because he dared to find a way forward, and because the ice held.But some part of her already knows that progress takes courage—the willingness to take the next step when the ground isn’t certain. Every one of us, from our earliest days, is living proof that last month’s impossible can become this morning’s milestones—that if we are only willing to try, with a little help from each other, we can build the future our families deserve.Thank you for the honor of building it together. God Bless the city and people of Boston. Let’s get back to work.
Good morning Boston, and Happy New Year! Congratulations to the Boston City Council, and a special welcome to our colleague, new to elected office—but not new to service—Reverend Councilor Miniard Culpepper.
To all our Councilors: Thank you for your faith in our city and your dedication to service as we strive to uphold the values on which our nation was founded. When you take your oath of office in the most acoustically perfect concert hall in America, the words ring with a special weight.
Boston Symphony Hall was the first concert hall in the world to be designed by renowned architects and a Harvard physics professor—who invented a formula to design this space with the perfect reverberation time: 1.9 seconds. Every angle and every surface, every statue tucked in every nook, reflects that uniquely Boston blend of science and the arts to serve the public good.
Thank you to our hosts at the BSO for sharing this beautiful venue with us, and for opening your doors to all the children of Boston as partners in our Boston Family Days program.
Video: ‘Threw down the gauntlet’: BU professor unpacks Wu’s inaugural speech
Governor Healey, Congresswoman Pressley, Congressman Auchincloss, Chairman Michlewitz, Leader Moran and Ellie, to my fellow mayors here today, and all of our state, county, and federal officials: Thank you for your partnership.
To our City workers, thank you for making everything we do possible. To my husband Conor; to Blaise, Cass, Mira, and my entire family—I love you so much. And to the people of Boston: Thank you for the honor of continuing our work together. Thank you for choosing to be a city that doesn’t settle or fold…for believing that a better world is possible, and working together to build it no matter what stands in our way.
2026 marks four years and two months since our administration took office—and 250 years since our nation was born. 250 years ago on this very day, a young man—the son of immigrants, and a BPS alum—was standing on the banks of a half-frozen river, focused on getting home to Boston.
Henry Knox was on a mission to bring cannons from Fort Ticonderoga—over 300 miles—to Dorchester Heights, where…with command of the high ground, General George Washington and the patriots could liberate Boston from British control. But between Knox and his city lay a nearly impossible obstacle for 60 tons of cannons to cross: The Hudson River, thawing in the sun, its surface a mosaic of splintering ice.
Without the cannons, he knew Boston would never be free. Without Boston, he knew the revolution would fail. So, over the next few days, Knox and his men crept out onto the ice in the coldest part of the night, drilling holes to let the water flow up from below and freeze over in thickening layers.
Faced with an impossible challenge, he did what Boston has always done best: With a blend of creativity and courage, imagination and will, he forged a path forward.
Four years ago, I was sworn in as mayor in the only building in Boston more beautiful than this one: City Hall. It was a small gathering, everyone was masked, and it felt—at the time—like we might never emerge from the endless cycle of constantly-evolving viruses threatening to keep us apart.
Still, we had hope.
Because in Boston, we know obstacles are opportunities to go beyond old ways of thinking—to innovate and set a new standard for the world to meet. For nearly four centuries, Boston has been the center of American innovation and progress: The place where revolutionary ideas get their start, where the impossible is overcome with creativity and courage, imagination and will.
So, four years ago, we got to work forging the path forward.
We promised to make Boston a home for everyone, starting with safety; and together, we drove gun violence down to the lowest levels on record. We refused to accept the broken status quo at Mass and Cass, coordinating a citywide response to permanently end encampments and connect thousands of people to recovery.
We prioritized housing like never before, building 4,200 affordable homes with another 2,000 under construction, tackling outdated zoning and red tape, converting vacant City lots and empty office buildings into hundreds of new homes, and helping more Boston families become first-time homeowners than ever before.
We expanded Boston pre-K to serve 5,000 families and helped 200 new childcare providers open their doors to our littlest learners. We taught more than 20,000 kids how to swim and ride bikes; expanded youth sports citywide; and made museums and performances free for every Boston kid and their family. Boston Public Schools graduation rates and attendance are up, and we’re on track to offer early college classes to every high school student by fall of 2028.
We saved residents and businesses more than $230 million dollars on energy bills, cut our retail vacancy rate nearly in half compared to two years ago, and made three bus routes fare-free. We repaved more than 100 miles of roadway, made it faster to fix sidewalks, and protected more miles of road for safe walking and biking than ever before.
We’ve seen how much is possible because of how far we’ve pushed forward, together. And we need to keep pushing.
Because, right now, in some ways, the world feels helplessly stuck—like we know what problems need fixing, but we’ve lost faith we can fix them. Today, the forces we face aren’t British troops on the Common or ships in our harbor, but they demand no less ingenuity.
Isolation, polarization, and misinformation are fraying our connection to trust, truth, and each other. Core industries are losing workers to competitors overseas. Against this backdrop the federal government is taking aim at the ways we take care of each other: They have slashed funding for emergency management, research, housing, education, and life-saving care; abducted our neighbors off sidewalks and outside our schools; crushed small businesses with trade wars and tariffs; trashed clean energy projects to profit billionaire donors; carried out unconstitutional military campaigns; and illegally deployed our troops against their own families and neighbors in peaceful American cities.
This federal administration has plundered our economy, ravaged our reputation, torched our institutions, and destroyed the lives of our people. But, when in the course of human events, it becomes necessary for a city to stand as the beacon for freedom and proof of what’s possible—a testament to the endurance of American ingenuity and civic success, Boston will be that beacon.
We will not appease or abet any threat to our city, and we will not wait for permission to build the world our families deserve. Over the next four years, Boston will be the proof that the nation we fought for is possible—a place where we take care of each other and take on the challenges that matter the most.
In our second term, we will reinforce the very foundations of our democracy: local government as the bedrock for getting results.
Making Boston the best city for families means getting the basics right and delivering on our most fundamental, most important work every day. Repaving streets and sidewalks, tending to our playgrounds and parks, and ensuring that every block of our city is healthy and safe, beautiful and welcoming for every one of our residents.
Nearly a century and a half before our nation was born, Bostonians were hosting town meetings to tackle together the challenges they couldn’t tackle alone. Our public parks, our schools, and our libraries were the first in the country because Boston was determined to be a democracy that’s direct and effective, focused unflinchingly on the public good.
This legacy lives on in every pothole filled, every library book borrowed, every playground filled with laughter. We will continue to make city services more efficient, responsive, and accessible in every way possible, across every neighborhood.
Starting this year, together with members of my Cabinet and the Office of Neighborhood Services, we will hold Mayor’s Office Hours across Boston: An opportunity to connect directly with residents, hear what’s working and what’s not, and unstick any city service issues in real time.
And, to ensure that every community member can count on City Hall, whether you’re opening a business, throwing a block party, or building a home—we’re going to streamline every city permitting process and set the bar for excellence in constituent services.
In this second term, on that foundation of excellence, we will build the country’s oldest public school district into the best—so that BPS is the first choice for all of our families.
Two miles from here, Boston opened the first public school in the country—the same school where Henry Knox learned to read. Two hundred years before the rest of the nation, we made a choice to make education a right. Today, we also choose operational excellence, academic rigor, and high expectations in every classroom.
We’ll continue rightsizing our district, investing in facilities and student supports, and improving transportation. We refuse to accept that accessing high quality education means crisscrossing our children all over our city rather than ensuring that, in every corner of Boston, the best school is just down the block.
We will revisit school assignment to be simpler and more predictable, reduce time students spend on the bus, and reinvest in advanced coursework, arts, and athletics. And because learning shouldn’t be confined to the first and last bell, with our community partners, we will offer quality before- and after-school programming available and accessible at every BPS school by the start of the 2027 school year.
And we will invest in the facilities our students and families deserve. Just last month, the Massachusetts School Building Authority selected BPS to start the process for a full rebuild at Madison Park Technical Vocational High School. And next year, we’ll cut the ribbon on the best student athletics facility of any public school district in the country at Boston’s own White Stadium.
With partnerships across every sector of the city focused on our schools, we will build reliable pathways to student success and make it our mission to get every last detail right for our BPS communities.
An educated citizenry is the lifeblood of Boston’s proud tradition of civic engagement, and the key to our economic success. And in this moment, we must continue to secure our sources of economic prosperity and defend the engines that drive innovation all across America.
We will fiercely defend our universities, our hospitals, our life sciences and innovation sector, so they can keep generating the breakthroughs that drive the progress our city is known for and our country needs.
We will ensure that Boston remains the place where people come to do good in the world, to solve the toughest problems that haven’t been solved: We will work smarter and harder to recruit the scientists and companies curing diseases like cancer and Alzheimer’s, harness clean energy, and improve lives all over the world.
We will partner with higher education and industry to nurture and benefit from the innovation that will reshape the future, from robotics to climate technology. Together, we will prepare workers for emerging technology to expand their opportunities rather than be replaced.
We will use our infrastructure investments and purchasing power to make our communities resilient against rising seas and stronger storms, and power our City with cleaner, more affordable energy. We will expand careers in green industries, including the construction trades, building operations, facilities management, stormwater infrastructure, horticulture, and engineering.
And for our city to flourish, Bostonians must be able to grow up and grow old here. We will work to address the housing needs of our families and seniors, focusing on solutions they want and can afford. Over the next four years, we will continue inventing new ways to use public planning, public finance, and public land to create the homes our residents need, because we know that housing is a public good.
We are the city that created whole new neighborhoods out of swampland and invented the triple-decker to tackle the housing crises of our past. We will not be defeated by the affordability crisis of the present. Together, we will deliver the best city services to all of our residents, set the standard for public education, and build an economy that will thrive for another two-and-a-half centuries.
If we can invent America, then we can be the city that forges the path forward in this moment.
Right now, backstage, there’s someone who doesn’t know anything about acoustics or walking on ice.
In fact, she’s just barely learning to walk. But, here with me this morning on this very stage, she took one wobbly step, then another, then looked up and laughed.
They weren’t her very first steps, but they were her first in a little while.
Unlike her older brothers, who couldn’t wait to go from wobbling to walking and running, Mira decided that, after taking her first two steps—and a tumble—a month ago, she wasn’t sure she wanted to do it again.
But, this morning, on this stage, she chose to try again knowing she might fall.
250 years ago, Henry Knox didn’t charge onto the ice of the Hudson. He wrote a letter to Washington explaining the challenge he faced. He took a moment to gather himself and reflect, but he didn’t wait for certainty, either.
With creativity and courage, imagination and will, he forged a path and pressed on—knowing the ice might not hold. Mira doesn’t know about Knox, or the physics that explain why her laughter this morning hung in this hall like a bell.
She doesn’t know that every March, we celebrate Evacuation Day here in Boston because Knox was creative and brave—because he dared to find a way forward, and because the ice held.
But some part of her already knows that progress takes courage—the willingness to take the next step when the ground isn’t certain. Every one of us, from our earliest days, is living proof that last month’s impossible can become this morning’s milestones—that if we are only willing to try, with a little help from each other, we can build the future our families deserve.
Thank you for the honor of building it together. God Bless the city and people of Boston. Let’s get back to work.

Manchester City defender Josko Gvardiol is set for a lengthy injury layoff after suffering a fractured tibia (shinbone) in his right leg.
City confirmed the Croatia international will undergo surgery later this week, the results of which would give the full extent of the diagnosis and potential timeframe for absence.
Earlier on Monday, City recalled centre-back Max Alleyne from his season-long loan at Watford after Pep Guardiola said on Sunday that Gvardiol and team-mate Ruben Dias could miss time with injury.
Dias and Gvardiol were substituted in the second half of City’s 1-1 draw with Chelsea on Sunday. Gvardiol was replaced in the 51st minute by Abdukodir Khusanov after a collision with Chelsea full-back Malo Gusto and had to be helped off the pitch, while Dias was substituted 30 minutes later.
This adds to City’s issues in defence, with John Stones sidelined with a thigh injury sustained in early December. Nathan Ake has only been used sparingly after undergoing foot surgery last season, making just two Premier League starts this campaign.
Due to City’s defensive issues, they have recalled the 20-year-old Alleyne from his loan spell in the Championship. The City youth graduate made 17 appearances for the second division side.
Alleyne has represented England at every youth level from under-17 to under-21, and was an unused substitute for City’s first team on seven occasions last season, including in the Premier League and Club World Cup.

Alleyne had been a regular for Watford in recent weeks (Leila Coker/Getty Images)
At his post-match press conference on Sunday, Guardiola did not put a timeframe on Gvardiol and Dias’ injuries but added that both are likely to miss time.
“We will see tomorrow (about the extent of Gvardiol’s injury), but it doesn’t look good for him or Ruben,” Guardiola said, via the City website. “I didn’t speak with the doctor but if Ruben is out, it is because he felt something.
“Of course, we have a lot (of injuries). John Stones is missing for many months; Ruben will be out and Josko will be out. Always we know with Nathan (Ake) that he cannot play regularly. After what happened last season, if we stay strong, we will find a solution and the spirit will be there.”
When asked if Dias had sustained a muscle injury, Guardiola said: “Yes, it looks like it.”
Khusanov, who missed almost two months himself earlier in the season with an ankle injury, is now a candidate to see an increase in game time, having made just seven starts in all competitions this campaign.
City, second in the table and six points behind leaders Arsenal, are next in action on Wednesday when they host Brighton & Hove Albion.
The clinic, featuring student-athletes from participating Duke’s women’s varsity sports, will run from 9-10:30 a.m., throughout all of Cameron Indoor Stadium. Each of the represented sports have a designated section in the arena to teach a sport-related skill or technique. The Duke Cheer and Dance teams along with the Blue Devil mascot will also be in attendance.
The clinic is free of charge and open to all kids in grades 1-8. A parent or guardian must be present at all times. Registration, although not required, is strongly encouraged. For more information and to register for the clinic, visit https://goduke.com/form/174.
“We are thrilled to host the seventh annual National Girls and Women in Sports Day Clinic and to once again welcome young people and families into Cameron Indoor Stadium,” said Vice President and King-Compton Families Director of Athletics Nina King. “This event is always a favorite among our student-athletes as it gives them the opportunity to connect, mentor, and inspire the next generation through sport. Creating a positive and engaging environment where kids can learn, have fun, and see strong female role models in action is incredibly important to us, and we’re proud to continue collaborating with the local community to celebrate the power of girls and women in sports.”
As a proud partner of Duke Athletics, Blue Cross NC has enhanced its commitment to youth mental health, connectivity and resiliency by being the presenting sponsor of National Girls & Women in Sports Day.
Blue Cross NC encourages participation in sports and an active lifestyle that supports physical and mental wellbeing. By partnering with youth, parents and community leaders like Duke Athletics, Blue Cross NC believes there is opportunity to help reduce stigmas associated with mental health for young people in sports.
To stay up to date with all things Blue Devils, follow Duke Athletics on Twitter, Instagram and Facebook by searching “DukeAthletics”.
#GoDuke
The 2025 Santa’s Helpers campaign provided donations to 32 local non-profit organizations.
DALLAS — Holiday magic came to life in a big way WFAA’s 56th annual Santa’s Helpers toy drive thanks to the incredible generosity in North Texas.
Here is a look at the impact of this year’s toy drive:
HOW MANY TOYS DID SANTA’S HELPERS COLLECT?
In 2025, Santa’s Helpers collected more than 58,000 gifts including more than 1,100 bicycles.
HOW MANY CHILDREN DOES THIS SERVE?
Santa’s Helpers encourages its non-profit partners to consider one gift per child. For 2025, more than 58,000 children received gifts from Santa’s Helpers. Santa’s Helpers serves ages newborn through 18 years old.
WHICH NON-PROFITS RECEIVED TOYS?
WFAA’s Santa’s Helpers distributed toys and bicycles to 32 local non-profit organizations located in Dallas, Tarrant, Collin, and Denton counties. Each organization is required to apply to become a Santa’s Helpers beneficiary. WFAA reviews each application and vets the organization’s financial statements and operations history prior to approving them as a beneficiary.
In 2025, WFAA’s Santa’s Helpers fulfilled its commitments to each non-profits at an average of 142%, meaning non-profits received more toys than were committed by Santa’s Helpers.
Santa’s Helpers 2025 beneficiaries include:
- ACH Child and Family Services
- Adventure & Victory Youth Inc.
- All Star Youth Sports Association
- Assistance Center of Collin County
- Chocolate Mint Foundation
- Community Partners of Dallas
- Como Lions Heart
- Compassionate Community Ministries
- Cornerstone Assistance
- Crowley House of Hope
- Dallas Champions
- Dallas International Street Church
- Denton County Toy Store at Asbury United Methodist Church
- Family Care Connection
- God’s Pantry
- Grace Grapevine
- Hope’s Door
- Inspired Vision
- Metrocrest Social Services
- Mission Arlington
- New Millennium Bible Fellowship
- Northside Inter-Community Agency
- Prosper Ladies Association
- Purple Hearts, Inc.
- Salvation Army of Fort Worth
- Salvation Army of McKinney
- Sharing Life Community Outreach
- St. Phillips School and Community Center
- Under 1 Roof
- Vogel Alcove
- West Dallas Multipurpose Center
- Youth World
WHERE DID MY FINANCIAL CONTRIBUTION GO?
WFAA’s Santa’s Helpers raised more than $260,000 in online donations. Santa’s Helpers uses these tax-deductible donations to purchase additional toys and bicycles from a wholesale partner.
HOW CAN I SUPPORT SANTA’S HELPERS YEAR-ROUND?
You can make a tax-deductible donation on our Santa’s Helpers page. Click here to make a donation. Donations raised throughout the year are used to purchase toys at wholesale prices in December 2026.
Special thanks to this year’s official Santa’s Helpers sponsors: Albertson’s / Tom Thumb, Amazon, Clay Cooley, and Milestone.
The success of Santa’s Helpers is made possible by the generosity of people and businesses across North Texas. Thank you for helping WFAA bring holiday happiness to more than 58,000 children this year. We look forward to serving more youth in 2026!
The high school girls hockey team will raise money for the Stead Family Children’s Hospital during a double-header on Jan. 10. Admission to both games is free.
DAVENPORT, Iowa — The Quad Cities Lady Blues are raising money for a QCA children’s hospital during a double-header showdown in Davenport this weekend!
The Lady Blues are a 19U high school girls ice hockey team based in Davenport. Their 3rd annual benefit game will be on Saturday, Jan. 10, at The River’s Edge. The money raised will benefit University of Iowa Health Care Stead Family Children’s Hospital.
The Lady Blues will play two games during the day, facing the Darien, Illinois, Chicago Hawks at 10:15 a.m. and the Afton, Missouri, Lady Liberty at 2 p.m. Both games are open to the public, with free admission and parking. Concessions will be available.
Throughout the morning and early afternoon, the team will also host a fundraiser benefiting both the Lady Blues program and Stead Family Children’s Hospital in Iowa City, the state’s only comprehensive children’s hospital. Fundraising activities will include a silent auction, 50/50 drawing, bake sale and basket raffle. Donations will also be accepted.
News 8 profiled the Lady Blues in 2023, highlighting the challenges many players faced before the team formed. Several athletes said they had grown up traveling hundreds of miles to play on other teams due to limited local opportunities. At the time, players spoke about paving the way for future generations of girls hockey players in the Quad Cities.
Girls hockey is among the fastest-growing youth sports in the United States, with programs expanding at the youth and high school levels nationwide.
The River’s Edge is located at 700 W River Drive in Davenport. More information about the fundraiser and other Lady Blues activities can be found on the Quad Cities Hockey Association Facebook pages, QCHA Lady Blues and Quad City Hockey Association.
Tune into The Current from 4 to 5 p.m. on weekdays to catch live interviews impacting you, your family and your hometown as well as all of the biggest headlines of the day.

The Indiana model arrives at Oklahoma State, where new ‘triplets’ could star

Daren Lucas Named President of the Motorsports Hall of Fame of America (MSHFA)
District 10 high school basketball midseason freshman of the year fan vote

Yamaha Motor Corp, USA, Promotes Dean Burnett to Senior Vice President and President of Motorsports Division

Mayor Michelle Wu Inauguration Address Monday, January 5, 2026

Manchester City’s Josko Gvardiol to undergo surgery after tibial fracture

How to fix the college football transfer portal
Summit Racing Equipment | Error 410: Resource Gone

Duke to Host 2026 National Girls and Women in Sports Day Youth Clinic

Daren Lucas Named President of the Motorsports Hall of Fame of America – Speedway Digest

Brittnay Estes – Assistant Coach/Recruiting Coordinator – Women’s Volleyball Coaches

Ranking Non-Super-Team Drivers | SVG, Zilisch Lose Sponsor? | Bristol Hockey Rumor
NCAA college football transfer portal. When does 2026 portal close?

This Week in Wake Forest Women’s Athletics – Presented by Truist (Jan. 5-11)

Tyler Legacy lands 5 on 6A All-State volleyball team

SoundGear Named Entitlement Sponsor of Spears CARS Tour Southwest Opener

Donny Schatz finds new home for 2026, inks full-time deal with CJB Motorsports – InForum

David Blitzer, Harris Blitzer Sports & Entertainment

DeSantis Talks College Football, Calls for Reforms to NIL and Transfer Portal · The Floridian
Elliot and Thuotte Highlight Men’s Indoor Track and Field Season Opener

#11 Volleyball Practices, Then Meets Media Prior to #2 Kentucky Match

Rick Ware Racing switching to Chevrolet for 2026

Colleges ponying up in support of football coaches, programs
West Fargo volleyball coach Kelsey Titus resigns after four seasons – InForum

Nascar legal saga ends as 23XI, Front Row secure settlement

Maine wraps up Fall Semester with a win in Black Bear Invitational

Stempien to seek opening for Branch County Circuit Court Judge | WTVB | 1590 AM · 95.5 FM

Ross Brawn to receive Autosport Gold Medal Award at 2026 Autosport Awards, Honouring a Lifetime Shaping Modern F1

Sunoco to sponsor No. 8 Ganassi Honda IndyCar in multi-year deal

Women’s track and field athletes win three events at Utica Holiday Classic


-
 Motorsports3 weeks ago
Ross Brawn to receive Autosport Gold Medal Award at 2026 Autosport Awards, Honouring a Lifetime Shaping Modern F1
-

 Rec Sports2 weeks ago
Princeton Area Community Foundation awards more than $1.3 million to 40 local nonprofits ⋆ Princeton, NJ local news %
-

 NIL3 weeks ago
Kentucky AD explains NIL, JMI partnership and cap rules
-
 Sports3 weeks ago
Three Clarkson Volleyball Players Named to CSC Academic All-District List
-

 Sports3 weeks ago
Beach Volleyball Unveils 2026 Spring Schedule – University of South Carolina Athletics
-

 Sports2 weeks ago
Badgers news: Wisconsin lands 2nd commitment from transfer portal
-
 NIL3 weeks ago
College football program loses 25 players to transfer portal
-

 Sports2 weeks ago
Is women’s volleyball the SEC’s next big sport? How Kentucky, Texas A&M broke through
-
 Rec Sports3 weeks ago
Refugee-Focused Youth Sport Initiatives : Moving for Change
-
 Rec Sports2 weeks ago
Youth Sports Business in 2025: The Year the Industry Grew Up