Technology
Multi-level data fusion enables collaborative dynamics analysis in team sports using wearable sensor networks

Experimental design and data collection
The experimental protocol was designed to capture collaborative dynamics across varying competitive scenarios while ensuring ecological validity and measurement reliability. Participant selection employed stratified random sampling from a population of semi-professional and collegiate athletes (n = 40, age: 22.6 ± 2.8 years, experience: 8.4 ± 3.2 years) competing in basketball and soccer. Inclusion criteria required a minimum of five years competitive experience, absence of musculoskeletal injuries within the preceding six months, and regular participation in team training sessions. Athletes were divided into balanced teams based on position-specific performance metrics, anthropometric characteristics, and years of competitive experience to minimize skill-level disparities that might confound coordination patterns.
The wearable sensor deployment strategy utilized a multi-nodal configuration designed to capture kinematic, physiological, and positional parameters simultaneously while minimizing interference with natural movement patterns. Each participant was equipped with five distinct sensor units strategically positioned to maximize signal quality while ensuring comfort and safety during dynamic movements. The sensor selection was based on precision requirements for capturing team coordination patterns, with sampling rates calibrated to detect rapid directional changes (15–20 Hz) characteristic of team sports. Each sensor node underwent pre-deployment calibration using manufacturer-specified protocols to ensure measurement consistency across devices (Table 1).
Data collection proceeded through a progressive protocol involving standardized small-sided games (4v4, 5v5) and simulated competition scenarios designed to elicit diverse collaborative patterns. The experimental protocol was structured as follows: Week 1–2 (baseline assessment), Week 3–4 (controlled scenarios), Week 5–6 (competitive simulations), Week 7–8 (validation testing). Each session comprised three 15-minute periods separated by 5-minute recovery intervals, with tactical constraints systematically manipulated across trials (e.g., defensive pressure levels: low/medium/high, spatial boundaries: 30 × 20 m/40 × 30 m/50 × 40 m, scoring objectives: possession-based/goal-oriented/transition-focused). Specific game scenarios included: (1) structured positional play with fixed formations, (2) high-pressure defensive scenarios, (3) transition-focused games with rapid possession changes, and (4) free-play competitive matches.
Each session comprised three 15-minute periods separated by 5-minute recovery intervals, with tactical constraints systematically manipulated across trials (e.g., defensive pressure, spatial boundaries, scoring objectives). Environmental conditions were standardized (temperature: 21 ± 1 °C, humidity: 45 ± 5%, indoor facility) to minimize confounding effects on physiological responses and movement patterns.
Quality control measures included pre-session sensor calibration, synchronized time-stamping across all devices, and redundant data storage systems. Signal quality was continuously monitored through real-time visualization interfaces, with automated alerts for sensor displacement or signal degradation. The signal-to-noise ratio (SNR) was calculated for each sensor stream according to:
$$\:SNR=20{\text{l}\text{o}\text{g}}_{10}\left(\frac{{A}_{signal}}{{A}_{noise}}\right)$$
where \(\:{A}_{signal}\) represents the amplitude of the intended measurement and \(\:{A}_{noise}\) denotes the amplitude of background noise. Data streams with SNR values below 15dB triggered recalibration procedures.
Raw data underwent multi-stage preprocessing to enhance signal quality and ensure compatibility with subsequent analysis algorithms, as illustrated in Fig. 2.

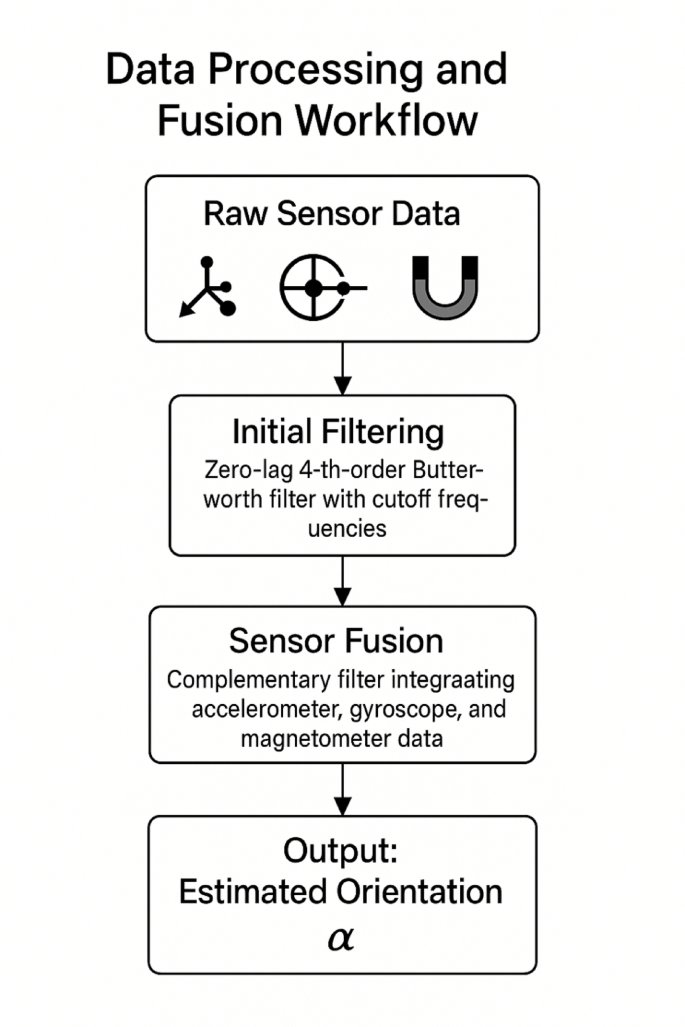
Data processing and fusion workflow.
Initial filtering employed a zero-lag fourth-order Butterworth filter with sport-specific cutoff frequencies determined through spectral analysis of pilot data. Sensor fusion at the individual level integrated accelerometer, gyroscope, and magnetometer data through complementary filtering to estimate three-dimensional orientation according to:
$$\:{\theta\:}_{t}=\alpha\:\left({\theta\:}_{t-1}+{\omega\:}_{t}\varDelta\:t\right)+\left(1-\alpha\:\right)\left({\varphi\:}_{t}\right)$$
where \(\:{\theta\:}_{t}\) represents the estimated orientation, \(\:{\omega\:}_{t}\) denotes angular velocity from gyroscope readings, \(\:{\varphi\:}_{t}\) indicates inclination calculated from accelerometer data, and \(\:\alpha\:\) represents the filter coefficient.
Ground truth references were established through a multi-method approach combining optical motion capture (12-camera system, 120 Hz) for a subset of trials, expert tactical annotation by qualified coaches (minimum UEFA A/FIBA certified), and performance outcome metrics. This triangulation approach generated validated event markers and coordination classifications that served as training and validation references for subsequent analytical algorithms. Data synchronization across all measurement systems was maintained through a master clock signal with temporal alignment verified through cross-correlation of common movement events.
All experimental procedures were conducted in accordance with the Declaration of Helsinki and relevant institutional guidelines and regulations for human research. The study protocol was reviewed and approved by the Ethics Committee of Dongshin University (approval number: DSU-2023-HR-042). Prior to participation, all athletes were provided detailed information about the study objectives, procedures, potential risks, and benefits. Written informed consent was obtained from all participants, with additional parental/guardian consent secured for any participants under 18 years of age. Participants were informed of their right to withdraw from the study at any time without consequence.
Novel data fusion algorithm design
Multi-level spatiotemporal data fusion architecture
The proposed data fusion framework employs a hierarchical architecture comprising three interconnected processing levels designed to progressively integrate heterogeneous sensor data while preserving critical spatiotemporal relationships. At the foundation, the Sensor-level Fusion (SLF) layer implements device-specific signal processing to harmonize raw measurements from individual sensor nodes. The intermediate Individual-level Fusion (ILF) layer consolidates multi-sensor data streams for each athlete into coherent movement and physiological profiles. The highest-order Team-level Fusion (TLF) layer integrates individual profiles to construct comprehensive collaborative dynamics representations across the entire team structure.
Information flow through this architecture follows a bottom-up processing sequence while incorporating contextual feedback loops to modulate sensor weights based on signal quality and situational relevance. The mathematical formulation of this hierarchical integration can be expressed as:
$$\begin{aligned} F_{{team}} = & \Phi _{{TLF}} \left( {W_{{TLF}} \cdot \left\{ {F_{{ind,1}} ,F_{{ind,2}} , \ldots ,F_{{ind,n}} } \right\}} \right) \\ F_{{ind,i}} = & \Phi _{{ILF}} \left( {W_{{ILF}} \cdot \left\{ {F_{{sen,i,1}} ,F_{{sen,i,2}} , \ldots ,F_{{sen,i,m}} } \right\}} \right) \\ F_{{sen,i,j}} = & \Phi _{{SLF}} \left( {W_{{SLF}} \cdot \left\{ {s_{{i,j,1}} ,s_{{i,j,2}} , \ldots ,s_{{i,j,k}} } \right\}} \right) \\ \end{aligned}$$
where \(\:{F}_{team}\) represents the team-level fused data, \(\:{F}_{ind,i}\) denotes individual-level fusion for athlete \(\:i\), \(\:{F}_{sen,i,j}\) indicates sensor-level fusion for sensor \(\:j\) on athlete \(\:i\), \(\:{s}_{i,j,k}\) represents raw signal \(\:k\) from sensor \(\:j\) on athlete \(\:i\), \(\:\varPhi\:\) symbolizes the fusion operation at each level, and \(\:W\) denotes the corresponding weight matrices.
Adaptive weight allocation mechanism
To accommodate the dynamic nature of team sports and varying reliability of sensor signals across different movement contexts, an adaptive weight allocation mechanism was implemented across all fusion levels. This mechanism dynamically adjusts fusion weights based on signal quality metrics, contextual relevance, and historical performance. The weight adjustment process utilizes a reinforcement learning framework with exponential decay to balance immediate signal quality assessments against established reliability patterns:
$$\:{w}_{i,t}=\lambda\:\cdot\:{w}_{i,t-1}+\left(1-\lambda\:\right)\cdot\:{q}_{i,t}\cdot\:{r}_{i,t}$$
where \(\:{w}_{i,t}\) represents the weight for data source \(\:i\) at time \(\:t\), \(\:\lambda\:\) denotes the temporal smoothing factor, \(\:{q}_{i,t}\) indicates the normalized signal quality metric, and \(\:{r}_{i,t}\) represents the contextual relevance score. The quality metric incorporates signal-to-noise ratio, sampling consistency, and measurement uncertainty, while the relevance score is derived from the relationship between sensor positioning and the specific movement patterns being analyzed.
Asynchronous data alignment algorithm
To address the heterogeneous sampling rates and transmission latencies inherent in multi-sensor networks, a novel asynchronous data alignment algorithm was developed. The proposed method extends traditional dynamic time warping with a phase-matched interpolation approach specifically calibrated for periodic and quasi-periodic movement patterns characteristic of team sports. The core alignment function employs a non-uniform B-spline interpolation framework governed by:
$$X_{{aligned}} \left( t \right) = \mathop \sum \limits_{{i = 0}}^{n} P_{i} N_{{i,d}} \left( t \right)$$
where \(\:{X}_{aligned}\left(t\right)\) represents the aligned signal at normalized time \(\:t\), \(\:{P}_{i}\) denotes control points derived from raw measurements, and \(\:{N}_{i,d}\left(t\right)\) represents the B-spline basis function of degree \(\:d\). The control point distribution is adaptively determined through a movement phase detection algorithm that identifies fundamental movement cycles (e.g., stride cycles, directional changes) and establishes correspondence across multiple sensor streams.
The temporal alignment quality is quantified through a phase coherence metric defined as:
$$C_{{phase}} = \frac{1}{N}\mathop \sum \limits_{{i = 1}}^{N} {\text{cos}}\left( {\phi _{i} – \bar{\phi }} \right)$$
where \(\:{\varphi\:}_{i}\) represents the estimated phase of sensor stream \(\:i\) and \(\:\overline{\varphi\:}\) indicates the reference phase derived from the highest-fidelity sensor available.
Multi-scale feature extraction and fusion
The feature extraction process implements a multi-scale decomposition approach to capture collaborative dynamics across different temporal and spatial resolutions. Wavelet packet decomposition is applied to decompose movement signals into distinct frequency bands corresponding to different movement components:
$$X_{{i,j}}^{k} = \mathop \sum \limits_{l} g_{{j,l – 2n}}^{k} X_{{i,l}}^{{k – 1}}$$
$$Y_{{i,j}}^{k} = \mathop \sum \limits_{l} h_{{j,l – 2n}}^{k} X_{{i,l}}^{{k – 1}}$$
where \(\:{X}_{i,j}^{k}\) and \(\:{Y}_{i,j}^{k}\) represent the approximation and detail coefficients at scale \(\:k\) for node \(\:j\) from signal \(\:i\), while \(\:g\) and \(\:h\) denote the low-pass and high-pass filter coefficients. This decomposition enables selective amplification of movement patterns most relevant to collaborative dynamics while suppressing sensor noise and individual idiosyncrasies.
Features extracted at multiple scales are subsequently integrated through tensor fusion, preserving the multi-dimensional relationships between athletes, sensor modalities, and temporal evolution:
$$\:\mathcal{T}=\mathcal{X}\underset{1}{\times\:}{W}_{1}\underset{2}{\times\:}{W}_{2}\underset{3}{\times\:}{W}_{3}$$
where \(\:\mathcal{T}\) represents the fused tensor, \(\:\mathcal{X}\) denotes the original feature tensor, and \(\:{W}_{i}\) represents projection matrices for each tensor dimension.
The optimal parameter settings for the data fusion algorithm were determined through systematic grid search optimization using 5-fold cross-validation on a dedicated training dataset (n = 20 participants, 160 sessions). Parameter optimization targeted three objectives: (1) minimizing position estimation error, (2) maximizing signal-to-noise ratio, and (3) maintaining real-time processing capability. The optimization process evaluated 144 parameter combinations across 4 weeks of testing, with final selections representing the Pareto-optimal balance between accuracy and computational efficiency. The detailed parameter settings and their optimization results are summarized in Table 2.
Fusion data quality assessment system
To ensure rigorous evaluation of the fusion outcomes, a comprehensive quality assessment system was established incorporating both technical and functional metrics. The technical quality evaluation employs information-theoretic measures including mutual information and entropy reduction to quantify the information preservation throughout the fusion process:
$$\:{Q}_{info}=\frac{I\left(X;F\right)}{H\left(X\right)}$$
where \(\:I\left(X;F\right)\) represents the mutual information between original signals \(\:X\) and fused output \(\:F\), while \(\:H\left(X\right)\) denotes the entropy of the original signals. Functional quality assessment evaluates the practical utility of fused data for collaborative dynamics analysis through comparison with ground truth annotations and established team performance metrics. This dual approach to quality assessment guides the continuous refinement of fusion parameters and adaptation of the algorithm to diverse team sport contexts.
Collaborative dynamics Indicator system construction
Based on the fused multi-source data, a comprehensive collaborative dynamics indicator system was established to quantify team coordination across multiple dimensions. The indicator design follows dynamical systems theory principles, where team coordination emerges from the interaction of individual agents under shared constraints58. Each indicator captures specific aspects of coordination: spatial indicators measure formation stability and positional relationships, temporal indicators quantify synchronization and timing, and functional indicators assess task-specific coordination effectiveness. The mathematical foundation ensures that indicators are sensitive to coordination changes while robust to individual performance variations.
This hierarchical framework incorporates metrics from individual, dyadic, sub-group, and whole-team levels to characterize coordination patterns at varying scales of organization. The system integrates spatial, temporal, functional, and contextual dimensions to provide a holistic representation of team collaborative dynamics relevant to performance outcomes in dynamic team sports environments.
Team Spatial collaboration assessment
To quantify spatial coordination patterns, a team spatial entropy method was developed that measures the organizational state of the team formation relative to strategic objectives and environmental constraints. The spatial entropy calculation incorporates both positional and velocity data according to:
$$S_{{spatial}} = – \mathop \sum \limits_{{i = 1}}^{n} \mathop \sum \limits_{{j = 1}}^{m} p_{{i,j}} {\text{log}}\left( {p_{{i,j}} } \right)$$
where \(\:{p}_{i,j}\) represents the probability of player \(\:i\) occupying spatial zone \(\:j\) within the tactical reference frame. This metric captures formation stability while accommodating appropriate variability required for adaptive team behavior. Complementing this global measure, a relative position maintenance index quantifies how consistently players maintain functional spatial relationships despite absolute position changes:
$$RPM = \frac{1}{{n\left( {n – 1} \right)}}\mathop \sum \limits_{{i = 1}}^{n} \mathop \sum \limits_{{j = 1,j \ne i}}^{n} \frac{{cov\left( {d_{{i,j}} \left( t \right),d_{{i,j}}^{{ref}} } \right)}}{{\sigma _{{d_{{i,j}} \left( t \right)}} \cdot \sigma _{{d_{{i,j}}^{{ref}} }} }}$$
where \(\:{d}_{i,j}\left(t\right)\) represents the distance between players \(\:i\) and \(\:j\) at time \(\:t\), and \(\:{d}_{i,j}^{ref}\) indicates the reference distance defined by tactical principles.
Temporal collaboration pattern recognition
For identifying recurrent temporal patterns in team coordination, a multi-scale cross-recurrence quantification analysis (MS-CRQA) algorithm was implemented. This approach detects synchronization patterns across multiple time scales by analyzing the cross-recurrence plots between pairs of movement trajectories:
$$CR_{{i,j}}^{\varepsilon } \left( {m,n} \right) = \Theta \left( {\varepsilon – \parallel X_{i} \left( m \right) – X_{j} \left( n \right)\parallel } \right)$$
where \(\:{X}_{i}\left(m\right)\) and \(\:{X}_{j}\left(n\right)\) represent the state vectors for players \(\:i\) and \(\:j\) at times \(\:m\) and \(\:n\) respectively, \(\:\varTheta\:\) is the Heaviside function, and \(\:\epsilon\:\) is the threshold distance. From these recurrence plots, quantitative measures including diagonal line entropy, determinism, and lamination are extracted to characterize the predictability and stability of coordination patterns.
The temporal synchronization between team members is further quantified through phase coherence analysis based on Hilbert transformation of movement signals:
$$\begin{aligned} \phi _{i} \left( t \right) = & {\text{arctan}}\left( {\frac{{H\left[ {x_{i} \left( t \right)} \right]}}{{x_{i} \left( t \right)}}} \right) \\ R\left( t \right) = & \left| {\frac{1}{n}\mathop \sum \limits_{{j = 1}}^{n} e^{{i\phi _{j} \left( t \right)}} } \right| \\ \end{aligned}$$
where \(\:{\varphi\:}_{i}\left(t\right)\) represents the instantaneous phase of player \(\:i\)’s movement, \(\:H\left[{x}_{i}\left(t\right)\right]\) denotes the Hilbert transform of position signal \(\:{x}_{i}\left(t\right)\), and \(\:R\left(t\right)\) indicates the phase coherence within the team at time \(\:t\).
Team-Individual performance relationship framework
To establish the relationship between collaborative dynamics and performance outcomes, a multilevel analytical framework was developed that bridges individual actions, interpersonal coordination, and team-level performance metrics. This framework employs structural equation modeling to quantify direct and indirect contribution pathways:
$$P_{{team}} = \beta _{1} C_{{spatial}} + \beta _{2} C_{{temporal}} + \beta _{3} \mathop \sum \limits_{{i = 1}}^{n} w_{i} P_{{ind,i}} + \varepsilon$$
where \(\:{P}_{team}\) represents team performance, \(\:{C}_{spatial}\) and \(\:{C}_{temporal}\) denote spatial and temporal coordination indices, \(\:{P}_{ind,i}\) indicates individual performance metrics, \(\:{w}_{i}\) represents player-specific contribution weights, and \(\:\beta\:\) values are path coefficients estimated through iterative model fitting.
The differential contribution of players to team coordination is assessed through influence network analysis, which identifies key coordination hubs and quantifies the propagation of movement information throughout the team structure. This approach reveals how tactical leadership emerges dynamically through gameplay rather than being strictly determined by formal role designations.
Visualization and quantitative assessment tools
A suite of visualization and assessment tools was developed to translate complex coordination metrics into actionable insights for coaches and analysts. These tools include interactive heat maps displaying spatial coordination patterns, phase-space portraits revealing system dynamics, and temporal evolution graphs identifying critical transition points in team coordination. Quantitative assessment modules provide automated detection of coordination breakdowns, identification of optimal coordination patterns associated with successful outcomes, and predictive modeling of how interventions might influence collaborative dynamics.
The comprehensive collaborative dynamics indicator system (Table 3) was established to quantify team coordination across multiple dimensions. Figure 3 demonstrates typical coordination patterns captured by these indicators during different game phases.

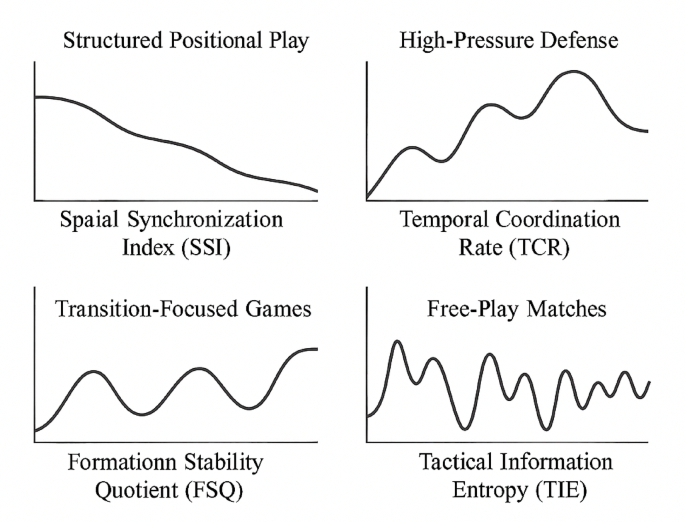
Collaborative dynamics visualization examples.
The integration of these indicators into a unified analytical framework provides a comprehensive assessment of team coordination across multiple dimensions and time scales. The modular structure of the indicator system allows for sport-specific customization while maintaining consistent underlying mathematical principles. By bridging theoretical constructs from dynamical systems theory with practical performance metrics, this framework enables both scientific analysis of coordination mechanisms and practical application in training and competition environments.