Visual analytics in sports performance analysis is an emerging field that combines data visualization techniques with analytical methods to enhance understanding and decision-making in sports. This area of research is particularly relevant as sports data becomes increasingly complex, encompassing various metrics such as player statistics, game dynamics, and tactical patterns. Recent studies have focused on […]

Visual analytics in sports performance analysis is an emerging field that combines data visualization techniques with analytical methods to enhance understanding and decision-making in sports. This area of research is particularly relevant as sports data becomes increasingly complex, encompassing various metrics such as player statistics, game dynamics, and tactical patterns. Recent studies have focused on developing interactive tools that not only assist coaches and analysts but also engage fans and journalists, thereby broadening the impact of data-driven insights in sports.
Recent Research
Pattern Mining: A data mining technique used to discover patterns or trends in large datasets, often applied in sports to analyze player tactics and strategies.
One significant area of research is the development of embedded visualizations that enhance the viewing experience for basketball fans. A study introduced a user-centered design framework for creating interactive visualizations that provide real-time data during live games. This approach aims to improve fans’ understanding of the game by presenting relevant statistics and insights directly within the game view, thus fostering greater engagement and enjoyment of the sport[1].
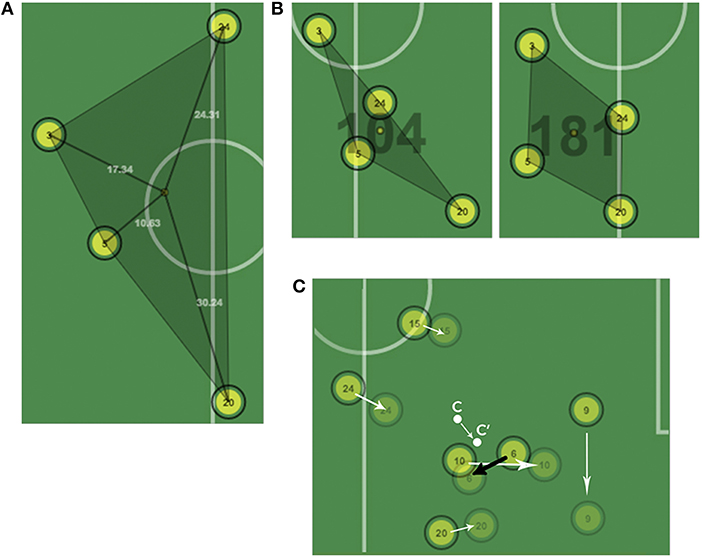
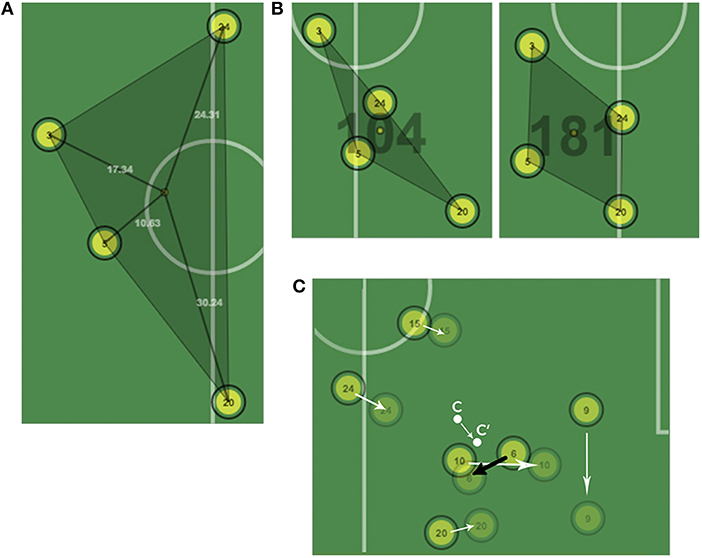
In basketball, the analysis of off-ball movements has gained attention through the OBTracker system. This tool focuses on the contributions of players who do not have the ball, providing a more comprehensive understanding of team dynamics and strategies. By employing a visual analytics approach, OBTracker enables coaches to assess the effectiveness of off-ball movements and develop better offensive strategies[4].
Lastly, the role of data in sports journalism has been explored, with researchers designing interactive visualization systems to assist basketball writers in creating data-driven narratives. These tools aim to simplify the exploration of complex datasets, enabling journalists to enhance their storytelling with relevant statistics and insights, thus adapting to the evolving landscape of sports reporting[5].
Another innovative tool, Tac-Trainer, leverages Internet of Things (IoT) technology to support racket sports training. By collecting kinematic data from wearable devices, Tac-Trainer transforms this data into actionable insights for coaches. The system integrates data interpretation and visualization, allowing coaches to optimize training sessions based on real-time feedback and performance metrics[3].
Technical Terms
Visual Analytics: The science of analytical reasoning supported by interactive visual interfaces, allowing users to explore and understand complex data.
Internet of Things (IoT): A network of physical devices connected to the internet, enabling them to collect and exchange data.
Multivariate Data: Data that involves multiple variables or measurements, often used to analyze complex relationships in sports performance.
In racket sports, the focus has been on interactive pattern mining systems that allow experts to integrate their domain knowledge with data analytics. The RASIPAM system enables coaches and analysts to discover meaningful tactics from multivariate event sequences, bridging the gap between data-driven insights and expert intuition. This interactive approach allows for real-time adjustments and refinements based on expert feedback, enhancing the tactical analysis process[2].


