
Technology
Enhancing track and field training feedback through 6G enabled transparent optical sensor networks

Optically transparent sensor architecture
The system was engineered to deliver high-precision timing and positional data suitable for field-based athletic monitoring (see Fig. 1). Optical gates were integrated with inertial sensors and deployed at the start, midpoint, and turning positions of the training circuit to capture athlete movements. Each gate utilized an infrared emitter operating at a wavelength of 850 nm, which was triggered upon motion interruption. The system demonstrated a response time of 5 ms and spatial accuracy of ± 1 mm, enabling near-instantaneous transmission of position data to the central control unit for real-time processing and feedback.

Sensor Architecture and Data Transmission Workflow. The diagram illustrates the dual sensor configuration and synchronization processes for real-time athlete monitoring. It includes optical gate integration, kinematic sensing, wireless transmission via UDP, and feedback delivery to coaches with packet loss mitigation strategies.
Sensor specifications and calibration
The sensor system comprised three modules (see Fig. 2): (1) four optical gates installed at 0 m (start), 5 m (midpoint), and 10 m (left/right turns), each using an IS471F infrared transceiver (Sharp Corporation, Japan) operating at 850 nm; (2) kinematic units combining LSM6DS33 accelerometers (± 16 g, STMicroelectronics, Switzerland), BNO055 gyroscope-orientation modules (Bosch Sensortec, Germany), and (3) a central processing node linked to a real-time dashboard. All modules communicated over a Wi-Fi 6 mesh (IEEE 802.11ax) backbone operating at 100 Hz sampling frequency. Each optical gate was calibrated using a mechanical rod moving at 2 m/s across the beam path at 2 m distance. Beam alignment was verified with a laser collimator (Thorlabs Inc., USA), and gate signal integrity was confirmed by three consecutive beam breaks per axis. Positional accuracy was maintained at ± 1 mm. Recalibration of optical gates occurred every 5 min using a fixed interval timer to suppress drift and verify emitter–receiver signal strength thresholds.
Kinematic sensor calibration followed a two-phase protocol. Static calibration was performed on a levelled aluminum reference plate; accelerometer readings were confirmed within ± 0.05 g of gravity (9.81 m/s²), and gyroscope offsets were adjusted to 0.0°/s using digital bias correction. Dynamic calibration involved mounting sensors on human and robotic lower limbs and performing three cycles of walking, jogging, and sprinting on a force-sensing treadmill. Sensor outputs (linear acceleration, angular velocity, orientation) were benchmarked against Vicon Nexus 2.10 motion capture (Oxford Metrics, UK). Alignment accuracy was verified to within ± 1° angular deviation and ± 0.02 m/s² acceleration RMS error across trials. Real-time correction was implemented via cross-sensor comparison with baseline lookup tables, compensating for drift, thermal offset (± 1.5 °C), and local electromagnetic anomalies. Calibration logs were auto-updated and checked at 15-minute intervals across all active nodes.

Components and Deployment of the 6G Transparent Optical Sensor System. The figure shows the primary hardware used: optical sensors, kinematic modules (BNO055, LSM6DS33), microcontroller (ATWINC1500), and mesh Wi-Fi routers (TP-Link Deco AX3000). The bottom row illustrates real-world deployment, including lab calibration setup, sensor-microcontroller integration, and wireless configuration for athlete monitoring.
Network setup and sensor integration
The system was installed on a Wi-Fi 6 (IEEE 802.11ax) mesh infrastructure configured to support a 30 m × 10 m training track. Three TP-Link Deco X60 routers (TP-Link Technologies Co., Ltd., China) were positioned at equidistant intervals (0 m, 15 m, 30 m) to establish a triangular mesh topology with continuous signal overlap. Signal strength across nodes was measured using a calibrated spectrum analyzer and held at − 50 dBm ± 3 dB. Each sensor node consisted of an ATWINC1500 Wi-Fi microcontroller (Texas Instruments, USA), hardwired via SPI interface to two sensor modules: (1) optical gate modules using IS471F IR transceivers (Sharp Corporation, Japan), and (2) inertial measurement units combining LSM6DS33 accelerometers (± 16 g) and gyroscopes (± 2000°/s) from STMicroelectronics (Switzerland). These units sampled data at 100 Hz, timestamped using monotonic counters synchronized through periodic broadcast pulses every 120 s. Optical gates were installed at four fixed points on the track: 0 m (start), 5 m (midpoint), 10 m (left turn), and 10 m (right turn). Beam calibration was performed using a laser alignment tool (ThorLabs Inc., USA), with cross-beam spacing fixed at 1.2 m and beam detection verified by passing a 2 m/s mechanical actuator through the IR path.
The microcontrollers performed real-time signal acquisition using interrupt service routines to capture beam breaks and inertial events. Pre-buffering queues (64 samples deep) were implemented in local memory to prevent data loss during transmission delays. Sensor outputs were packetized into structured arrays (acceleration [m/s²], angular velocity [°/s], position flag [on/off]) and wirelessly transmitted to the central control server over the mesh network using UDP. Network integrity was tested through controlled packet loss trials, with simulated peak traffic conditions (1.2× nominal load) confirming < 0.5% packet loss. Devices were manually resynchronized every 2 min using scheduled handshake signals to correct for clock drift.
Latency and data processing
Each sensor unit integrated the ATWINC1500 wireless module (Texas Instruments, USA) and operated with a 100 Hz sampling rate. The microcontroller used interrupt-driven acquisition, triggered when either linear acceleration exceeded ± 0.2 g or angular velocity exceeded ± 10 °/s. Upon triggering, six motion parameters (acceleration (x, y, z) and angular velocity (x, y, z)) were acquired and temporarily buffered. Local buffering employed a circular memory stack that held up to 5 s of data (500 frames), enabling continuous acquisition during short-term communication disruptions.
Signal integrity was maintained using a second-order Butterworth low-pass filter with a 12 Hz cutoff applied in real time to all motion channels. Each buffered frame was timestamped with synchronized local time, corrected every two minutes via NTP synchronization over the mesh network. Transmission was conducted over a Wi-Fi 6 (IEEE 802.11ax) mesh network with QoS prioritization. Multi-threaded routines managed transmission and preprocessing independently, minimizing queuing delay and enabling a processing-to-transmission time of < 100 ms per event.
Real-time feedback and analysis
Each ATWINC1500 microcontroller (Texas Instruments, USA) transmitted 6-axis motion data (3-axis acceleration, 3-axis angular velocity) over a 2.4 GHz Wi-Fi 6 mesh network to a central control station. Transmission was achieved via UDP protocol with fixed routing tables based on MAC-ID pairing. The central control node parsed sensor packets into discrete channels, assigned each stream to a real-time processing queue based on source identifier, and computed velocity (m/s) and stride length (m) via numerical differentiation of positional vectors. Joint angular displacement (°) was derived from gyroscope-integrated quaternion transformations, using a fixed sampling frequency of 100 Hz.
Each sensor stream was mapped to a shared buffer and visualized via a real-time rendering engine built using Python and OpenGL, refreshing at 100 Hz to maintain sampling-to-display synchronization. Predefined thresholds for asymmetry detection and jump-angle deviation were set per athlete using baseline calibration trials. When deviation exceeded ± 1.5 SD of baseline metrics, system interrupts triggered visual alerts. The processed feedback was output to a Samsung Smart Display (Samsung Electronics, South Korea), positioned at the control center within line-of-sight of both coach and athlete during trials.
Design of optical gates
Each gate consisted of a paired emitter–receiver assembly. Emitters were IS471 infrared modules (Sharp Corporation, Japan) operating at 850 nm, mounted at 1.2 m height. Opposite each emitter, BPW34 photodiodes (OSRAM Opto Semiconductors, Germany) captured the beam after reflection from eight-facet BK7 polygonal prisms (Thorlabs Inc., USA) mounted on aligned vertical supports. When an athlete passed through the beam path, interruption triggered a digital signal event logged to the local gate controller at 1000 Hz.
Gate locations were fixed at 0 m (start line), 5 m (course midpoint), and 10 m (left and right turns) using a Leica DISTO D2 laser rangefinder (Leica Geosystems AG, Switzerland) with ± 0.5 cm spatial precision. During calibration, a mechanical rod (1.5 kg, 1.5 m length) was propelled at 2 m/s to validate beam-break latency using timestamped signals. Signal timestamps were synchronized with kinematic sensors via a 1 Hz pulse broadcast across the local network from a reference synchronization module integrated into the control station’s master clock.
Integration of system and data flow
The sensor system was implemented on a Wi-Fi 6 mesh network. Optical gates equipped with polygonal prisms and silicon PIN photodetectors (BPW34, OSRAM Opto Semiconductors, Germany) were positioned at the start, midpoint, and turning zones to capture passage timing and body orientation with angular precision of ± 0.1°. Concurrently, kinematic data such as acceleration, angular velocity, and stride length were acquired via wearable IMU modules incorporating accelerometers and gyroscopes.
Sensor data were pre-processed by ATWINC1500 microcontrollers (Texas Instruments, USA) using local filtering and buffering, then transmitted wirelessly to the control center through TP-Link Deco X60 routers (TP-Link Technologies Co., Ltd., China). These routers, arranged in a mesh configuration, sustained signal strength at − 50 dBm across a 30 m training zone. The central processing unit received data at 100 Hz, generating live dashboard displays with performance indicators such as turning velocity, stride dynamics, and joint displacement. Coaches accessed this interface during sessions to facilitate immediate feedback and targeted training adjustments.

Flowchart of Pilot Testing and Statistical Analysis. The diagram outlines participant recruitment, group assignment, sensor-based data collection, and statistical evaluation using t-tests. Significant results (p < .05) led to group comparisons, while non-significant findings prompted variable adjustments and re-testing.
Pilot testing
A pilot study (see Fig. 3) was conducted at the Hangzhou Asian Games between September and October 2023, involving 40 athletes recruited through coordination with the Hangzhou Asian Games Organising Committee (HAGOC). Stratified random sampling ensured equal representation of both sexes across selected track and field disciplines including sprints (100 m, 200 m), long jump, high jump, and 4 × 100 m relay. Eligibility screening was performed by on-site sports physicians and exercise scientists using a standardized intake protocol. Inclusion criteria were: (i) age ≥ 16 years at the time of enrolment, confirmed via official registration documents; (ii) minimum of 12 months of competitive participation in an accredited athletics federation, verified by athlete registration cards; (iii) absence of injury confirmed via physical screening using the Functional Movement Screen (FMS™, Functional Movement Systems Inc., USA), requiring a composite score ≥ 14; (iv) prior exposure to wearable sensor technologies such as GPS, HR monitors, or IMUs, assessed via a structured device-use questionnaire; (v) successful completion of a baseline fitness assessment comprising a 20 m shuttle run (cutoff VO₂max ≥ 40 ml/kg/min for females and ≥ 45 ml/kg/min for males, calculated using Léger’s formula) and standing broad jump (cutoff distance ≥ 1.5 m for females and ≥ 1.8 m for males); and (vi) written informed consent authorizing data use for anonymized research purposes. Exclusion criteria included: (i) athletes aged < 16 years; (ii) presence of musculoskeletal injuries in the last three months confirmed via self-report and physician examination; (iii) underlying cardiopulmonary disease as indicated by ECG abnormalities (assessed using CardioSoft v6.73, GE Healthcare, USA); and (iv) refusal to permit the use of sensor or biometric data for study analysis.
Ethical considerations
The Hangzhou Asian Games Organising Committee (HAGOC) granted ethical approval for the study (Approval No. 569-HAGOC-001). The study adhered to the principles outlined in the Declaration of Helsinki for ethical research involving human participants. Informed consent was obtained from all participants before their involvement in the study. Participants were assured of anonymity, and personal identifiers were removed to ensure confidentiality. Participants were fully informed about the study’s aims, procedures, and potential risks before consenting to participate.
Data collection
Participants were randomly assigned to either the experimental group (n = 20) or control group (n = 20) using a computer-generated randomization sequence (block size = 4) administered by an independent researcher. A double-blind design was maintained: athletes and assessors were blinded to group allocation during baseline and post-testing phases. Data collection occurred over a 14-day intervention period, with each athlete completing 4 to 5 standardized training sessions (60 min each) across non-consecutive days to ensure ≥ 24 h recovery between sessions.
Each training session comprised three sequential phases (see Fig. 4). In the warm-up phase (10–12 min), athletes performed dynamic mobility drills, including 3-minute treadmill jogging at 6 km/h, followed by dynamic stretches (leg swings, high knees, and butt kicks). In the movement training phase (30–35 min), athletes completed a fixed protocol including 3 sets each of shuttle runs (10 m, 20 m), vertical jumps (3 maximal efforts), and lateral bounding. During this phase, the experimental group was fitted with the optical and inertial sensor suite, capturing real-time kinematic parameters including stride length (cm), ground contact time (ms), angular velocity (°/s), and horizontal velocity (m/s), synchronized at 100 Hz. The sensors were activated 30 s before drill onset to ensure system stability, and real-time feedback was streamed to the dashboard interface. Performance metrics were relayed to coaches via visual and auditory cues. The control group received coaching only via verbal instruction without sensor feedback. Cool-down (10–12 min) included static stretching and low-intensity aerobic activity (3-minute walk at 4 km/h).
Baseline and post-intervention assessments were conducted immediately before the first session and within 24 h following each participant’s final training session, maintaining consistent environmental conditions. Metrics included: (i) 20 m sprint time measured via optical gate timing (ms), (ii) vertical jump height (cm) using a Just Jump Mat (Just Jump System, USA), and (iii) standing broad jump distance (cm).

Sequential Phases of Running Gait Captured Using the 6G Transparent Optical Sensor System. The image illustrates the toe-off, flight, and landing phases, annotated with corresponding real-time data points including stride length, joint angles, and ground contact time recorded by the optical and kinematic sensors.
Comparative analyses
To establish biomechanical validity, the 6G Transparent Optical Sensor (6G-OPS) system was calibrated and benchmarked against three industry-standard technologies: a high-speed camera system operating at 240 frames per second (GoPro HERO11, GoPro Inc., USA), the Vicon Motion Capture system (Vicon Motion Systems Ltd., UK), and two wearable inertial measurement units Catapult Vector S7 (Catapult Sports, Australia) and Zepp Tennis 2 Sensor (Huami Corporation, China). A subset of trials was conducted in a controlled biomechanics lab where all systems were mounted and synchronized using an external triggering mechanism to ensure temporal alignment. Data streams from each system were processed using custom MATLAB (MathWorks Inc., USA) scripts, applying identical filtering algorithms to account for timing drift, latency, and noise suppression. Validation procedures followed ASTM F2392 standards for motion capture benchmarking, aiming to achieve sub-millimeter positional fidelity and sub-degree angular resolution.
Statistical analysis
All statistical analyses were performed in GraphPad Prism version 9.5.1 (GraphPad Software, San Diego, USA). Descriptive statistics (mean ± SD) were calculated for all performance variables. Normality was assessed using the Shapiro–Wilk test. Parametric tests were applied to normally distributed data; otherwise, non-parametric equivalents were used. A two-way repeated-measures ANOVA (factors: group and time) was conducted to evaluate training effects, followed by Tukey’s HSD for post hoc comparisons. Baseline between-group differences were assessed via independent t-tests, and within-group changes were analyzed using paired t-tests. Statistical significance was set at p < .05.


The ‘Summit 65+,’ presented in a Dreamcast-inspired design, features a CNC aluminum case, stainless steel back plate, and Higround’s ‘Dampening Plus’ five-layer system for a stable, quiet typing experience. The ‘Basecamp 65HE,’ influenced by the Radical Highway level, debuts Hall Effect technology for increased precision. Additional offerings—including the Classic Sonic–themed ‘Basecamp 96+,’ two ‘Basecamp 75+’ versions inspired by Escape from the City and Sonic CD, a Sonic CD keycap set, and four coordinated XL mousepads—further unify the collection’s nostalgic yet contemporary character.
Image Credit: Higround
Technology
How Miami’s Sports Culture Reflects the High-Energy Mindset Driving Today’s Tech Innovations – Five Reasons Sports Network

The Competitive Spirit That Powers Both Sports and Startups
Miami sports fans know that greatness comes from more than talent alone. Whether it’s the Heat grinding through a tight fourth quarter or the Dolphins executing a perfectly timed offensive scheme, winning requires discipline, fast thinking, and an unshakeable competitive spirit. Interestingly, these same qualities power the tech and startup world, where entrepreneurs make split-second decisions that can define the future of an entire business.
In both arenas, success belongs to those who can read momentum, adapt under pressure, and turn small opportunities into game-changing wins. That overlap is why so many sports-minded individuals naturally thrive in the world of business, innovation, and technology.
Why Analytics in Sports Fuel Smarter Business Thinking
Today’s sports landscape is driven by analytics—shot charts, win probability graphs, EPA metrics, and possession efficiency numbers are all part of modern fan knowledge. This analytical mindset doesn’t stop at the arena. Tech entrepreneurs, founders, and investors rely on the same data-driven thinking to navigate product decisions, market shifts, and competition.
This crossover is why the startup world attracts problem solvers shaped by sports culture. And platforms in the entertainment-tech space—such as Foxy gold casino—reflect this growing connection between digital innovation, predictive thinking, and user engagement.
Understanding Momentum: A Shared Advantage for Founders and Athletes
Momentum is everything. In sports, a single run, turnover, or three-pointer can change the energy in seconds. In business, momentum might be a viral post, a successful beta launch, or hitting a major funding milestone. Leaders in both fields understand how to recognize momentum and capitalize on it.
This parallels perfectly:
- Athletes ride hot streaks.
- Founders capitalize on traction.
- Sports teams adjust mid-play.
- Startups pivot product strategy just as quickly.
The ability to shift gears on the fly is one of the most important skills in sports and tech alike.
Building a Winning Strategy: What Startups Can Learn From Miami Sports
1. Scouting and Research Matter
Sports teams invest heavily in scouting reports and film studies. They evaluate:
- Opponent strengths
- Player tendencies
- Lineup matchups
- Efficiency ratings
Startups mirror this with market research, user interviews, competitive analysis, and data modeling. Knowing the landscape allows founders to execute smarter, faster, and with more confidence.
2. Team Culture Determines Long-Term Success
The Miami Heat built the “Heat Culture,” known for discipline, conditioning, and accountability. Startups adopting similar cultural principles see major benefits:
- Clear leadership and communication
- Defined expectations
- Continuous improvement
- Resilience under pressure
A strong culture is often the difference between a startup that scales—and one that collapses.
3. Adaptability Separates Winners From the Rest
Sports demand constant adjustments: defensive rotations, halftime strategies, and clutch-time decisions. Startups face equally rapid shifts:
- Market changes
- New competitors
- Shifting user demand
- Technological breakthroughs
Founders who adapt quickly, without losing their vision, stay competitive.
Table: Business Lessons Inspired by Miami’s Sports Playbook
| Miami Sports Principle | Startup Application | Tech/Innovation Impact |
| Heat Culture | Strong internal systems | Higher productivity & retention |
| Film study & analytics | Market and user research | Better decision-making |
| In-game adjustments | Product pivots | Faster adaptation to trends |
| Team chemistry | Cross-functional collaboration | Smoother product scaling |
| Game-winning mentality | Resilient leadership | Strong long-term growth |
How Miami’s Fast-Paced Environment Fuels Innovation
South Florida’s sports scene is known for energy, excitement, and bold plays. Coincidentally, Miami’s startup scene mirrors that same intensity. The city has quickly become a hub for fintech, AI, gaming, and digital entertainment. Entrepreneurs here are used to speed—speed of execution, iteration, and scaling.
A few reasons Miami is thriving in the innovation sector:
- Diverse global talent
- High investor interest
- Strong tech community backing
- Growing digital entertainment market
- Crossover influence from sports and media
Miami is one of the few cities where sports culture and startup culture genuinely feed each other.
Technology Is Changing the Game—On the Field and in the Office
Technology has reshaped sports with player-tracking systems, real-time analytics, and dynamic stat models. Meanwhile, tech startups use automation, AI-driven insights, and SaaS platforms to accelerate growth. Both industries depend on innovation to stay ahead.
Today’s fans and founders alike have access to tools such as:
- Predictive analytics
- Machine learning insights
- Automated reporting dashboards
- Real-time performance tracking
- Competitive intelligence platforms
This shared tech ecosystem keeps both sports teams and startups laser-focused on performance.
The Role of Mindset: What Makes Sports Fans Natural Innovators
Sports fans understand pressure. They analyze plays, debate strategies, track performance trends, and anticipate outcomes. These instincts make them naturally suited for entrepreneurship and tech leadership.
Key mindset overlaps include:
- Confidence under pressure
- Long-term thinking
- Understanding risk and reward
- Embracing competition
- Continuous improvement
Sports create thinkers who thrive in fast-paced, unpredictable environments—the exact conditions startups face daily.
Why the Connection Between Sports and Startups Keeps Growing
Sports influence is everywhere—from data modeling to team culture to leadership strategy. At the same time, tech continues to elevate sports through analytics, digital enhancements, and real-time engagement tools. The crossover strengthens every year, especially in vibrant markets like Miami.
As both industries push forward, one thing remains true: the mindset that wins games is the same mindset that builds the next big company. Athletes, analysts, fans, and founders all share a core advantage—a competitive drive, sharpened by strategy, that fuels consistent growth.
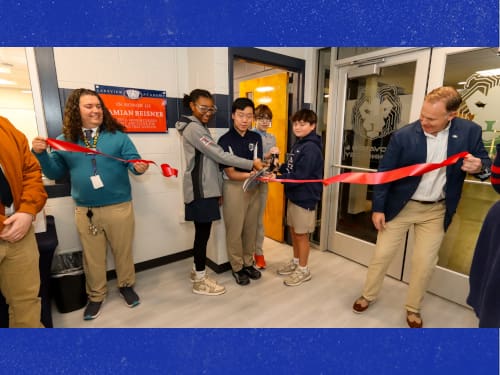
Lakeview Academy in Gainesville recently unveiled its newly renovated Innovation and Technology Wing.
The learning environment is designed to inspire creativity, collaboration, and hands-on problem-solving.
“The expanded robotics and esports facilities give our students room to imagine bigger and build bolder,” Technology Director Mikhail Lovell, said. “With advanced tools like industrial laser cutters and high-performance 3D printers, they can design and create with a level of precision and freedom that we couldn’t offer before. This renovation strengthens the programs our students already love while opening the door to new opportunities for innovation, growth, and achievement.”
School officials said the renovation was made possible through Lakeview donors and community partners who share in the school’s mission to cultivate curiosity, excellence, and forward-thinking leadership.
“This renovation represents more than just new facilities,” John Simpson, Head of School at Lakeview Academy, said. “It is an investment in our students’ future and a reflection of Lakeview’s vision to provide a learning environment that mirrors the innovation and collaboration found in today’s leading industries.”

The Game Awards 2025 concluded on December 11 in Los Angeles, celebrating a standout year in gaming. The ceremony unveiled the full All Winners List across major categories, including Game of the Year, Best Art Direction, Best Narrative, and more. Fans tuned in worldwide to see whether Clair Obscur Expedition 33, Death Stranding 2 On the Beach, or Donkey Kong Bananza would claim top honors.
This year delivered an unusually competitive field. Nearly every major genre saw multiple critically acclaimed releases. The All Winners List highlights how diverse the gaming landscape has become, rewarding innovation, storytelling, performance, and design. Below is the complete breakdown of winners as confirmed during the live show.
Full All Winners List for The Game Awards 2025
The Game Awards recognized excellence across more than 30 categories. The All Winners List below reflects the official results announced during the broadcast. These selections were made through a combination of jury voting and fan participation. Trusted outlets such as Reuters and AP covered the event throughout the week, citing its global impact on the entertainment industry.
The ceremony featured wins for established franchises, emerging studios, and standout indie titles. Clair Obscur Expedition 33 dominated several major categories, cementing its status as one of the year’s most influential releases. Death Stranding 2 On the Beach and Hollow Knight Silksong also secured notable wins across art, music, and direction.

The winners list includes categories such as:
- Game of the Year
- Player’s Voice
- Best Game Direction
- Best Adaptation
- Best Narrative
- Best Art Direction
- Best Score and Music
- Best Audio Design
- Best Performance
- Innovation in Accessibility
- Games for Impact
- Best Ongoing Game
- Best Community Support
- Best Independent Game
- Best Debut Indie Game
- Best Mobile Game
- Best VR/AR Game
- Best Action Game
- Best Action/Adventure Game
- Best RPG
- Best Fighting Game
- Best Family Game
- Best Sim/Strategy Game
- Best Sports/Racing Game
- Best Multiplayer Game
- Most Anticipated Game
- Content Creator of the Year
- Best Esports Game
- Best Esports Athlete
- Best Esports Team
Each winner reflects the shifting trends of interactive entertainment. Publishers invested heavily in cinematic storytelling, AI-driven mechanics, and world-building. Indie studios saw renewed recognition, demonstrating how smaller teams continue to push creative boundaries.
How the 2025 All Winners List Shapes the Industry
The impact of the All Winners List extends far beyond the ceremony. Industry analysts note that Game Awards recognition often boosts sales, renews franchise momentum, and influences publisher strategies for the following year. Reuters reported that award-winning titles typically experience a significant rise in global downloads after the show’s conclusion.
For indie creators, nominations and wins can accelerate distribution partnerships and platform support. For major studios, standout wins in categories such as Game Direction or Narrative reinforce creative leadership and help guide long-term development pipelines.
The All Winners List also redirects attention toward emerging technologies showcased in nominated titles. VR advancements, accessibility innovations, and audio engineering breakthroughs from this year’s winners are expected to shape next-generation game design approaches.
The Game Awards 2025 All Winners List underscores how far the medium has evolved. It highlights a year defined by risk-taking, creativity, and boundary-pushing design. Fans now look ahead to 2026 as studios aim to build on the momentum created by this remarkable lineup of winners.
FYI (keeping you in the loop)-
Q1: What is included in The Game Awards 2025 All Winners List?
The list includes winners across more than 30 categories, covering major genres and industry achievements. Categories range from Game of the Year to Best Esports Team.
Q2: Which game won the most awards in 2025?
Clair Obscur Expedition 33 earned multiple major category wins, reflecting strong critical and fan support.
Q3: Why is The Game Awards All Winners List important?
The list influences sales trends, industry recognition, and future project investment decisions. It sets expectations for upcoming releases.
Q4: How are winners selected for The Game Awards?
A combined jury and public voting system determines winners. Both professional critics and global players contribute.
Q5: Does winning an award impact game development studios?
Recognition often leads to increased funding, hiring, and platform visibility. It can also validate creative direction for future titles.
iNews covers the latest and most impactful stories across
entertainment,
business,
sports,
politics, and
technology,
from AI breakthroughs to major global developments. Stay updated with the trends shaping our world. For news tips, editorial feedback, or professional inquiries, please email us at
[email protected].
Get the latest news and Breaking News first by following us on
Google News,
Twitter,
Facebook,
Telegram
, and subscribe to our
YouTube channel.


Gaming PC Market is witnessing rapid expansion as gaming evolves into one of the largest and most impactful segments of the digital entertainment industry. According to Market Research Future (MRFR), the Gaming PC Market Size was valued at USD 46.98 billion in 2024. The Gaming PC industry is projected to grow from USD 50.41 billion in 2025 to USD 101.9 billion by 2035, exhibiting a strong and consistent compound annual growth rate (CAGR) of 7.29% during the forecast period from 2025 to 2035.
The rise of high-performance gaming hardware, increasing popularity of competitive gaming, and strong global demand for immersive entertainment experiences are major factors supporting market growth. Gaming PCs are now central to professional eSports, casual gaming, and content creation, making the industry a key driver of technological innovation.
Market Drivers Fueling the Growth of the Gaming PC Market
One of the primary drivers accelerating the Gaming PC Market is the explosive rise of the global eSports ecosystem. Millions of players participate in online competitions, and large-scale tournaments attract global audiences. Professional gamers demand high-performance PCs capable of delivering maximum responsiveness, minimal lag, and high frame rates, directly boosting the need for advanced gaming systems.
Another critical driver is rapid GPU and CPU innovation. Leading hardware manufacturers continue to develop powerful processors and graphics cards equipped with next-generation capabilities such as ray tracing, AI-enhanced rendering, and ultra-fast clock speeds. These innovations significantly elevate gaming experiences and motivate both casual gamers and professionals to upgrade their systems.
The increasing popularity of open-world, high-resolution, and graphically demanding games is further boosting Gaming PC adoption. Modern titles require advanced hardware to support realistic visuals and immersive gameplay, pushing consumers toward high-end gaming PCs.
The rise of game streaming and content creation is also contributing to market expansion. Platforms such as Twitch, YouTube Gaming, and Facebook Gaming are encouraging gamers to produce high-quality content. This requires powerful systems that support streaming, recording, editing, and gameplay simultaneously.
Customization and personalization trends are shaping consumer behavior as well. Gamers increasingly prefer custom-built PCs with RGB lighting, advanced cooling solutions, and modular components. This trend is creating new opportunities for manufacturers, retailers, and PC assembly services globally.
Get An Exclusive Sample of the Research Report at – https://www.marketresearchfuture.com/sample_request/26477
Key Market Trends Shaping the Gaming PC Market
The Gaming PC Market is being reshaped by a number of powerful trends. One of the most significant is the integration of artificial intelligence into gaming hardware. AI-driven optimization tools help maximize performance, regulate cooling, enhance frame rates, and adjust settings in real time.
Another major trend is the growing dominance of high-performance gaming laptops. With advancements in thermal engineering and GPU performance, gaming laptops now offer nearly desktop-level power. This trend supports gamers who value flexibility and portability without sacrificing performance.
High-refresh-rate monitors are becoming standard among gamers. Demand for 144Hz, 240Hz, and even 360Hz displays is rising as gamers seek smoother animation and higher responsiveness, driving the need for PCs capable of supporting these advanced displays.
Liquid cooling systems are also gaining popularity. As gaming hardware becomes more powerful, maintaining safe temperatures is essential. Gamers increasingly adopt closed-loop and custom-loop liquid cooling systems to ensure long-term stability and performance.
Sustainable and energy-efficient gaming solutions are emerging as a new trend. Manufacturers are focusing on recyclable components, environmentally friendly production processes, and energy-efficient power supplies. This aligns with global sustainability awareness and appeals to environmentally conscious gamers.
Buy Now Immediate Delivery Available at – https://www.marketresearchfuture.com/checkout?currency=one_user-USD&report_id=26477
Regional Analysis of the Gaming PC Market
North America currently dominates the Gaming PC Market, supported by a large base of professional gamers, robust digital infrastructure, and widespread adoption of high-performance gaming systems. The United States remains a global leader in gaming hardware development and eSports investment.
Europe holds a significant share of the market as well. Countries such as Germany, France, and the United Kingdom have strong gaming cultures, extensive PC gaming communities, and widespread interest in competitive gaming. Government recognition of eSports as an official sport in certain regions has further strengthened market demand.
The Asia-Pacific region is poised for the highest growth rate during the forecast period. Nations such as China, South Korea, Japan, and India are expanding rapidly in the gaming ecosystem. China leads the region with millions of active gamers and strong investment in gaming arenas, esports stadiums, and internet cafés. South Korea remains a global pioneer in professional gaming and eSports.
Latin America is also witnessing rising Gaming PC adoption. Countries such as Brazil, Mexico, and Argentina are experiencing increasing interest in professional gaming and streaming, supported by improved internet connectivity and the establishment of local gaming events.
In the Middle East and Africa, gaming is expanding as younger populations adopt digital entertainment. Countries such as the UAE and Saudi Arabia are investing heavily in eSports infrastructure, creating new opportunities for Gaming PC manufacturers.
Challenges and Constraints in the Gaming PC Market
Despite strong growth potential, the Gaming PC Market faces several challenges. One major constraint is the high cost of components such as GPUs, CPUs, and high-performance RAM. Price fluctuations and supply shortages often discourage consumers from purchasing or upgrading gaming PCs.
Another challenge is the global supply chain volatility that affects semiconductor manufacturing. Limited chip availability during periods of high demand can delay product releases and reduce availability in key markets.
Energy consumption and heat generation are significant constraints as well. High-performance systems require efficient cooling solutions, and inadequate thermal management can impact performance and hardware longevity.
The rapid pace of technological change can also be a barrier for consumers. Frequent hardware upgrades may be required to support the latest games, making ownership costly for budget-conscious gamers.
Cybersecurity concerns surrounding online gaming and digital downloads pose additional challenges. Gamers are at risk of malware attacks, hacking, and data breaches, making security software an essential component of gaming setups.
Opportunities Driving Future Growth of the Gaming PC Market
Despite challenges, the Gaming PC Market offers vast opportunities. The expansion of VR and AR gaming is creating strong demand for powerful gaming PCs capable of supporting immersive experiences. As VR titles grow more sophisticated, hardware requirements will increase, benefiting the Gaming PC industry.
Cloud-connected gaming PCs present another major opportunity. Hybrid gaming systems that combine traditional hardware with cloud-based rendering can enhance performance and enable cost-effective upgrades.
The rise of gaming-focused social platforms is opening opportunities for PC manufacturers and accessories companies. Integrated ecosystems that support gaming, streaming, editing, and social interaction are becoming increasingly popular.
Emerging markets present strong potential for future expansion. Countries in Southeast Asia, the Middle East, Eastern Europe, and Africa are witnessing fast-growing gaming communities and rising disposable incomes, driving demand for affordable gaming PCs.
The growing support for STEM education and gaming-related careers such as game development, animation, and broadcasting is also fueling market demand. Students and professionals require powerful machines that deliver both gaming and productivity performance.
Explore the In-Depth Report Overview – https://www.marketresearchfuture.com/reports/gaming-pc-market-26477
The Gaming PC Market is set for robust expansion as global demand for high-performance gaming systems continues to rise. With a projected CAGR of 7.29% through 2035, the industry will benefit from technological innovation, eSports growth, immersive gaming trends, and rising participation in global gaming communities. Gaming PCs are becoming more advanced, more customizable, and more accessible, making them essential tools for gamers, streamers, content creators, and digital professionals alike. As hardware manufacturers push boundaries and gaming culture expands worldwide, the Gaming PC Market will remain a powerful driver of digital entertainment and global technological development.
About Market Research Future:
At Market Research Future (MRFR), we enable our customers to unravel the complexity of various industries through our Cooked Research Report (CRR), Half-Cooked Research Reports (HCRR), Raw Research Reports (3R), Continuous-Feed Research (CFR), and Market Research & Consulting Services.
MRFR team have supreme objective to provide the optimum quality market research and intelligence services to our clients. Our market research studies by products, services, technologies, applications, end users, and market players for global, regional, and country level market segments, enable our clients to see more, know more, and do more, which help to answer all their most important questions.
Contact Us:
Market Research Future (Part of Wantstats Research and Media Private Limited)
99 Hudson Street, 5Th Floor
New York, NY 10013
United States of America
+1 628 258 0071 (US)
+44 2035 002 764 (UK)
Email: sales@marketresearchfuture.com
Website: https://www.marketresearchfuture.com
This release was published on openPR.

A mobile-class processor powers the unit and includes 16 GB of RAM and up to 1 TB of internal storage. A dual-fan assembly and heat pipe design provide cooling. Battery capacity supports several hours of sustained gameplay, depending on the title and settings. Wireless connectivity includes Wi-Fi 6 and Bluetooth 5.2.
Image Credit: AYANEO

Lady Vikings basketball off to dominant 9-0 start behind young core, ‘Whatever It Takes’ mentality

Pitt Volleyball Advances To Fifth Straight National Semifinal

Nick Saban sounds alarm with 2-word condemnation of college football

Sunday Morning Quarterback: The gauntlet, the gold and the Aggie uprising

JuJu Watkins attends USA Basketball camp and focuses on leadership during ACL rehab

Football club to offer young women college pathway

1 injured, 1 arrested after shooting at youth football tournament in Collier County |

Orange County boys basketball highlights, final scores for Friday, Dec. 12 –

H.S. Basketball: Eight Schuylkill League teams off to hot starts in 2025 | Football

UAPB Track & Field Student-Athletes Among Top UAPB Chancellor’s Medallion Recipients at Fall 2025 Commencement

New Central girls coach wants his players to have fun playing basketball | Western Colorado
Heisman winner Fernando Mendoza, Indiana football emerges as superpower

Fernando Mendoza wins the Heisman Trophy as college football’s top player :: WRALSportsFan.com

Here’s how much money Heisman Trophy finalists Mendoza, Pavia and Love made from NIL deals this season

Donald Trump Looks at Federal Government While Hinting at NIL Changes Amid ‘Disastrous’ Run

First Tee Winter Registration is open

Fargo girl, 13, dies after collapsing during school basketball game – Grand Forks Herald

CPG Brands Like Allegra Are Betting on F1 for the First Time

Volleyball Recaps – November 18

F1 Las Vegas: Verstappen win, Norris and Piastri DQ tighten 2025 title fight

Two Pro Volleyball Leagues Serve Up Plans for Minnesota Teams

Utah State Announces 2025-26 Indoor Track & Field Schedule

Sycamores unveil 2026 track and field schedule
Jo Shimoda Undergoes Back Surgery

Redemption Means First Pro Stock World Championship for Dallas Glenn

Texas volleyball vs Kentucky game score: Live SEC tournament updates

Robert “Bobby” Lewis Hardin, 56

How this startup (and a KC sports icon) turned young players into card-carrying legends overnight

Bowl Projections: ESPN predicts 12-team College Football Playoff bracket, full bowl slate after Week 14

Pohlman admits ‘there might be some spats’ as he pushes to get Kyle Busch winning again

 NBA Legend Michael Jordan to Join NBC Sports as Special Contributor
 Why a rising mid-major power with an NCAA Tournament team opted out of revenue-sharing — and advertised it
 Falcons mailbag
 Portal Update – Basketball and Gymnastics Take Hits
 has always dreamed in Mercurial. Now his initials are on the boots.
The new Kyl…
has always dreamed in Mercurial. Now his initials are on the boots.
The new Kyl…
-
 Rec Sports3 weeks ago
First Tee Winter Registration is open
-
 Rec Sports2 weeks ago
Fargo girl, 13, dies after collapsing during school basketball game – Grand Forks Herald
-
 Motorsports3 weeks ago
CPG Brands Like Allegra Are Betting on F1 for the First Time
-
 Sports3 weeks ago
Two Pro Volleyball Leagues Serve Up Plans for Minnesota Teams
-
 Sports3 weeks ago
Utah State Announces 2025-26 Indoor Track & Field Schedule
-
 Sports3 weeks ago
Sycamores unveil 2026 track and field schedule
-
 Motorsports2 weeks ago
Redemption Means First Pro Stock World Championship for Dallas Glenn
-

 Motorsports2 weeks ago
Jo Shimoda Undergoes Back Surgery
-
 Sports3 weeks ago
Texas volleyball vs Kentucky game score: Live SEC tournament updates
-
 Rec Sports2 weeks ago
Robert “Bobby” Lewis Hardin, 56