
Technology
Predictive Analytics Is the Next Frontier for Media Company Growth


AI is reinventing the way media companies can analyze their business, from precise forecasts to finding new business opportunities to optimizing yield. In all of these cases, data is required to deliver these new insights. Media companies with access to good data gain the ability to see around corners, get ahead of their competition and anticipate audience behavior and advertiser demand.
Consider these examples of how predictive analytics can transform media company strategy:
- Accurate audience prediction to help sell inventory
- Advertiser demand forecasting to help price inventory
- Competitive analysis to time content releases optimally
- Campaign analytics that help optimize delivery and performance
- Predictive yield analytics to drive investment more effectively
The move to predictive analytics is critical for growth. With increased competition from every angle, media companies need to take advantage of these new innovations to move faster and make more informed strategic decisions. However, the foundation of great analytics is access to the right data and technology, which requires media companies to prioritize elements of their business that might not be as obvious as audience growth or content development – but are just as important for future growth.
Data, A Foundational Driver Of Success
As the advertising ecosystem becomes increasingly automated, media companies have more complexity and more data to contend with than any time in the past. Rather than offering an opportunity, this shift is seen as a burden by many media company leaders. PWC found that 57% of media company CEOs believe that their company won’t be viable in the next few years, significantly more than across other industries surveyed. And, the study found that 46% said one of their most significant challenges was accessing and monetizing data.
This pessimism needs to change if media companies are going to succeed and it needs to start with data. Data has become one of the most valuable assets within a media company portfolio, but not enough media executives are prioritizing it. Equally as valuable as content, audience and capital, data is emerging as the critical lever that unlocks growth for media companies. But old data, or data sitting neglected is not going to provide value. Media companies must prioritize data to tap into its power. This means ensuring that the right data is collected, and that it is housed in a way that is accessible as usable.
AI Technology for Better Analysis and Forecasting
If data is the fuel, AI technology is the engine, taking media companies where they want to go. Too many media companies have outdated technology that delivers inaccurate analysis or takes an increasing amount of manual work, which slows the business down. The right approach unifies insights across the business, works quickly and automates the process.
AI delivers a significantly more powerful, accurate and faster approach to analytics that can give media companies a completely new perspective on their business at nearly every level. When used effectively, predictive analytics tools empower media companies to move from a reactive stance to a proactive one. Instead of waiting to see how audiences behave or which advertisers show up, predictive analytics enables companies to plan inventory, pricing, and campaigns around where demand is going—not where it was. Here are a few examples
Predictive Audience Modeling
Different platforms offer predictive modeling capabilities that allow media companies to forecast audience demand for content, audience movement across different channels and platforms (such as the move from broadcast to streaming) and which subscribers are likely to engage or churn. These platforms integrate first-party, second-party, and third-party data to build more robust audience profiles, enabling precise targeting and higher yield for advertising campaigns.
Inventory Optimization
Inventory forecasting and yield management solutions use predictive analytics to help media companies better allocate their ad inventory. These tools can predict high-demand periods, optimize pricing in real time, and help avoid under- or over-booking of premium inventory. Dynamic pricing engines built into these systems allow media companies to adjust rates based on supply, demand, and market conditions automatically.
Forecasting and Revenue Intelligence
These tools help with revenue planning, providing real-time insights into future revenue streams by analyzing sales pipelines, advertising bookings, historical performance, and market indicators. They allow media companies to create more reliable revenue projections, set smarter sales targets, and proactively address risks to revenue.
With audience behaviors shifting and advertiser demands evolving, traditional forecasting models—often reliant on spreadsheets and siloed data—are no longer enough. The rise of predictive analytics, powered by AI and machine learning, is reshaping how media companies allocate inventory, price effectively, and drive revenue.

Related Articles

NPAW’s Gary Hunsberger on Streaming Analytics, AI-Driven Insights, and Expansion Plans in the U.S.
In this interview with Streaming Media contributing editor Jan Ozer, Gary Hunsberger, general manager of U.S. operations at NPAW (Nice People At Work), outlines the company’s approach to end-to-end quality monitoring, actionable data, and monetization support. Hunsberger, who joined NPAW seven weeks before NAB 2025, shares how the company differentiates itself in a crowded analytics market, discusses future AI integration plans, and previews growth initiatives in the U.S. and Canada.
25 Apr 2025

Wowza CEO Krish Kumar Talks Product Strategy, Enhanced Analytics, and AI for Encoding and Metadata
In November 2024, Wowza appointed Krish Kumar CEO. Understanding where Kumar plans to take Wowza is critical to all those whose businesses touch streaming video. To learn more about Krish and Wowza’s future direction, contributing editor Jan Ozer interviewed him about ten days before NAB 2025.
02 Apr 2025

How Streaming Platforms Can Harness Predictive Analytics for Better Retention
Beau Decker of Endeavor Streaming discusses how streaming platforms can harness predictive analytics to shape retention strategies, help reduce churn, and sometimes even shape the content being produced.
05 Jun 2023
The Importance of OTT Analytics
Keeping viewers engaged with a wide variety of content on a platform that is both intuitive and user-friendly is key for revenue growth, reducing churn, and building your customer base. To achieve this, a data-driven content strategy equipped with OTT analytics must be in place. OTT analytics offer invaluable insight into content performance, advertising metrics, and technical statistics to help providers shape the customer experience, improve streaming quality, and put personalization at the forefront.
05 Aug 2022

India’s gaming industry is rapidly evolving into one of the largest and most dynamic markets in the world. Driven by the increasing adoption of smartphones, affordable internet, and a tech-savvy youth population, gaming is becoming a mainstream form of entertainment. With mobile gaming leading the charge, the India gaming market is also witnessing significant growth in esports, cloud gaming, and immersive technologies like augmented reality (AR) and virtual reality (VR).
Unlocking New Realms: The Evolution and Key Opportunities in India’s Gaming Sector
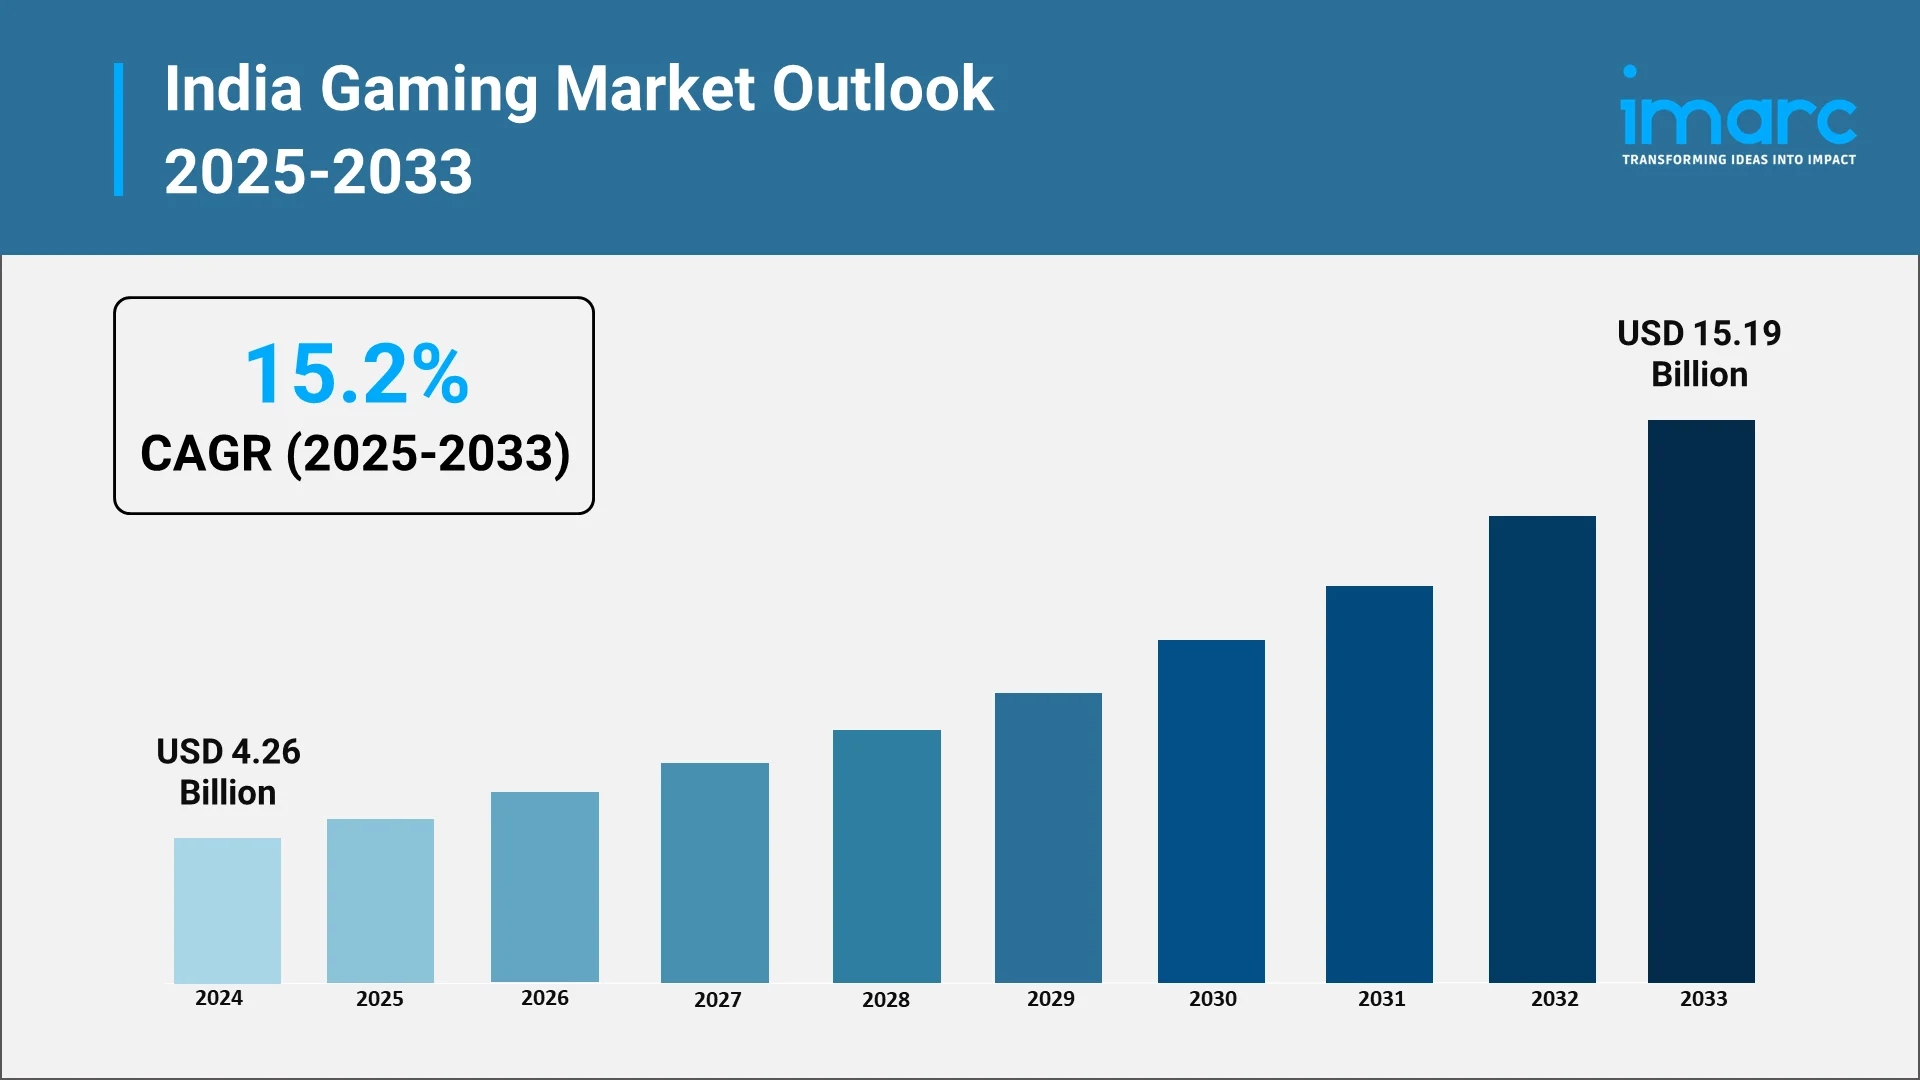
The gaming sector is transitioning from a specialized sector to a dynamic and swiftly growing market, fueled by the rising use of smartphones, accessible internet, and a young, tech-oriented demographic. The rise of mobile gaming is at the heart of this transformation, with millions of people in India engaging in gaming on their smartphones daily. With the nation’s gaming industry growing, a variety of gamers, covering mobile, console, and PC platforms, are shaping the industry. Quantifying this rapid expansion, the IMARC Group reported that the gaming market size in India reached USD 4.26 Billion in 2024.
The primary opportunities ahead are in the rising need for localized content, as developers are concentrating on designing games that connect with Indian cultural and regional tastes. This presents substantial potential to reach a broader audience, especially in tier-2 and tier-3 cities. Moreover, the growth of esports, cloud gaming, AR, and VR technologies offers new opportunities for expansion. With the growing investment and support from both the government and private sectors, there is significant potential to establish India as a worldwide center for gaming development and creativity.
With the market’s maturation, the advancement of monetization strategies, enhanced infrastructure, and stronger regulations will continue to contribute to the increase in India gaming market share, unlocking untapped potential and fostering global competitiveness.
Explore in-depth findings for this market, Request Sample
Game On: Current Trends and Market Drivers Shaping India’s Gaming Future
According to IMARC Group’s projections, the India gaming market is projected to grow at a CAGR of around 15.2% from 2025 to 2033, reaching USD 15.19 Billion by 2033. The growth will be supported by the following factors:
- Smartphone and Internet Penetration
India’s increasing number of affordable smartphones, coupled with the expansion of high-speed internet access, is significantly broadening the market reach. As rural and non-metro areas gain improved connectivity, companies can target new user segments beyond urban centers. This growing accessibility enables casual, on-the-go gaming, contributing to a surge in user numbers and expanding the market. As of March 2024, India had 954.40 million total internet subscribers, with 398.35 million rural subscribers. Furthermore, by April 2024, 95.15% of India’s 644,131 villages were equipped with 3G/4G mobile connectivity, underscoring the increasing digital penetration across the country and creating vast opportunities for gaming expansion in rural areas.
- Monetization Evolution: In–App, Subscription & Cloud
The monetization models in the gaming market in India are evolving beyond basic in-app purchases. Traditional in-app purchases are being complemented by subscription models, cloud streaming, and cross-platform play, providing new revenue streams and catering to players seeking more flexibility and value. This shift allows gaming companies to offer premium experiences while enhancing player lifetime value. A prime example of this trend is Nvidia’s announcement in 2025 that its GeForce NOW cloud gaming service will launch in India, offering high-end gaming experiences on various devices. Premium members can access over 4,500 games, including popular titles like Borderlands 4 and Call of Duty: Black Ops 7, solidifying cloud gaming’s potential in India.
- Esports Partnerships and Innovation
A key factor driving the growth of the market is the increasing investment in esports partnerships and innovation. Realme’s collaboration with Krafton India as the official smartphone partner for the BattleGrounds Mobile Series (BGIS) 2025 and BGMI Pro Series (BMPS) 2025 highlights this trend. By using its GT 7 Pro for the tournaments, Realme is directly supporting both professional and grassroots players. This partnership not only boosts esports visibility but also strengthens the gaming ecosystem in India. As esports continues to gain traction, such collaborations enhance the gaming experience and contribute to market expansion.
- Localized Product Offerings and Market Tailoring
The growing availability of localized products tailored to the needs of Indian gamers is positively influencing the market. Acer’s announcement in 2025 to launch “Make in India” gaming laptops is a prime example. By customizing its Aspire/ALG, Nitro, and Predator series for the Indian market, Acer is addressing the performance, pricing, and usage patterns unique to Indian gamers. This move not only supports the rising demand for gaming PCs across casual, competitive, and creator segments but also taps into the rising interest in AI-ready devices, contributing to the rapid expansion of India’s gaming ecosystem.
The rise of accelerator programs and funding initiatives is helping local developers access advanced technology, mentorship, and global networks. The adoption of AI tools is particularly transformative, enhancing game development, player experiences, and monetization strategies. These AI-driven innovations improve gameplay mechanics, automate processes, and offer personalized content, making Indian games more competitive globally. A prime example is Meta’s India-focused Gaming Accelerator, launched in 2025, which supports 20–30 emerging studios with AI tools like Llama, along with mentorship and investor access to scale their games for global markets.
The Game Plan: Conquering Challenges and Unlocking New Opportunities
The Indian gaming industry encounters challenges like regulatory ambiguity, with many states lacking clear rules for online gaming, creating confusion for developers and players. The country’s vast and diverse population also requires significant investment in localization and culturally relevant content. Additionally, piracy and data security concerns remain persistent threats.
Despite these obstacles, the rapid increase in internet access and smartphone adoption, particularly in tier-2 and tier-3 cities, presents a large untapped market. Mobile gaming is becoming popular because of affordable smartphones and data plans, while localization offers a chance to engage diverse user bases. The growing momentum of the India Mobile Gaming Market further highlights how digital engagement is expanding across demographic groups. Esports and online competitions are also gaining traction, creating new opportunities for competitive gaming and sponsorships.
Masters of the Game: Who’s Leading India’s Gaming Industry
Major figures in the market are progressively concentrating on broadening their reach and enhancing user interaction by utilizing mobile-first approaches and integrating localized content. These firms are focusing on creating games that align with local tastes, providing content in various languages and crafting gameplay that reflects India’s rich cultural diversity. Numerous developers are investigating fresh monetization strategies, such as in-app purchases, subscription models, and live events, while incorporating social and multiplayer elements to promote community engagement. To remain competitive, they are significantly investing in technology like AI and cloud gaming to improve user experiences and provide smooth cross-platform play. Directly illustrating the investment in technology like cloud gaming to improve user experiences and provide smooth cross-platform play, Xbox launched cloud gaming in India for Game Pass subscribers in 2025, allowing high-end games to stream on mobiles, tablets, and PCs.
.webp)
The Game Changers: How Investment and Government Support Are Elevating the Gaming Sector
The gaming market in India is influenced by government-backed initiatives and a clear regulatory framework that foster innovation and growth. These programs support game design, development, and talent, attracting both local and global investments. The regulatory system ensures fair practices and transparency, building market trust and safeguarding user interests.
- Government-backed programs are essential in driving innovation and creating a vibrant gaming ecosystem in India. By supporting game design, development, and talent nurturing, these initiatives provide infrastructure, networking, and industry collaboration that attract both local and global investments. They also focus on cultivating local talent, ensuring the sector’s sustainability and competitiveness. The government’s commitment is evident in major initiatives like the Create in India Challenge and the AVGC-XR Mission, launched in 2025, which aim to foster original creation and collaboration across gaming, animation, VFX, and immersive technologies. These efforts strengthen India’s creative economy and position the country as a global hub for AVGC-XR innovation.
- A coherent regulatory system is vital for driving the gaming market in India. By establishing clear rules and categories for different game types, such as esports and online gaming, the framework ensures transparency and fair practices, fostering trust among investors and participants. This organized approach enhances market security for both developers and users, promoting sustainable growth. In 2025, the Ministry of Electronics and Information Technology (MeitY) addressed the need for such a framework with the release of the Draft Promotion and Regulation of Online Gaming Rules under the PROG Act. This created India’s first unified framework, with the Online Gaming Authority overseeing compliance, classification, and registration.
Leveling Up: IMARC’s Playbook for Navigating India’s Thriving Gaming Market
IMARC Group empowers stakeholders in India’s gaming industry with data-driven insights to succeed in one of the world’s fastest-growing entertainment markets. Our research and consulting services help clients identify untapped opportunities, navigate market uncertainties, and drive innovation in game design, marketing, and retail strategy.
- Market Insights: Track trends shaping India’s gaming market, including the rise in mobile gaming, increasing demand for esports, and the growing popularity of educational and strategy-based games. We also explore the emergence of local developers and the expanding gaming ecosystem.
- Strategic Forecasting: Predict future developments in the integration of digital and physical gaming experiences, the growth of online gaming platforms, evolving user preferences, and the impact of regional content and culturally relevant game narratives.
- Competitive Intelligence: Analyze strategies and offerings from leading game publishers and emerging startups, including how they are redefining gaming experiences with local themes, storytelling, and sustainable production practices.
- Policy and Regulatory Analysis: Understand trade regulations, intellectual property protection, licensing, and safety compliance standards crucial to the production and distribution of games in India.
- Tailored Consulting Solutions: Benefit from customized advice on market entry strategies, distribution models, branding, and game localization. IMARC’s expertise supports businesses in developing scalable, client-centric growth strategies in an expanding gaming ecosystem.

The New Nevada Gaming Board Chairman knows the importance of getting technology OK’d quickly, signaling a clear focus on modernizing how gaming innovations move from development to casino floors. This approach reflects an understanding that technology now plays a central role in the gaming industry and that regulatory systems must evolve to keep Nevada competitive while maintaining its high standards.
New Chairman Knows the Importance of Approving Technology
Gaming technology is advancing at a rapid pace, from new slot machine platforms to cashless systems and enhanced security tools. When approvals take too long, Nevada risks seeing new products debut elsewhere first. The New Nevada Gaming Board Chairman knows the importance of getting technology approved quickly because delays can affect manufacturers, casino operators, and ultimately the state’s position as a leader in regulated gaming.
Industry Experience Shaping Regulatory Priorities
Leadership matters in regulatory agencies, especially in industries as complex as gaming. The new chairman brings experience that bridges regulation and technology, offering insight into how long approval timelines can impact innovation. This background helps explain why the New Nevada Gaming Board Chairman knows the importance of getting technology OK’d quickly, not as a shortcut, but as a way to make processes more efficient and predictable.
How Faster Approvals Benefit Nevada’s Gaming Industry
Timely technology approvals help casinos remain competitive and allow players to experience the latest advancements sooner. When Nevada can approve new gaming systems without unnecessary delays, it strengthens relationships with manufacturers and reinforces the state’s reputation as the global standard for gaming regulation.
Maintaining Integrity While Moving Faster
Speed does not mean sacrificing oversight. Nevada’s gaming regulators are still responsible for ensuring fairness, security, and compliance. The emphasis is on refining internal processes, improving communication, and reducing bottlenecks. This balanced approach explains why the Nevada Gaming Board Chairman knows the importance of getting technology approved quickly while continuing to uphold strict regulatory safeguards.
What This Means for the Future of Gaming Regulation
Looking ahead, a more responsive approval process could encourage greater innovation within Nevada’s gaming sector. Developers may be more inclined to launch new technologies in the state, and operators can adapt more quickly to player expectations.
By aligning regulatory efficiency with technological progress, Nevada positions itself to remain both a trusted regulator and an innovation-friendly environment in an increasingly competitive global gaming market.
Looking for Legal Guidance in Gaming?
If you follow SCCG content and have inquiries about your gaming business, connect with Lazarus Crystal Law Firm—formed by SCCG Management and Lazarus Legal to unite top-tier gaming law with commercialization and market-entry strategy.
Our Areas of Expertise Include:
• Nevada and multi-state gaming licensing
• Regulatory compliance and audit services
• International market entry and cross-border advisory
• Gaming M&A legal due diligence
• Tribal gaming legal and strategic support
• iGaming and sports betting regulatory guidance
Follow us on LinkedIn: Lazarus Crystal Law Firm
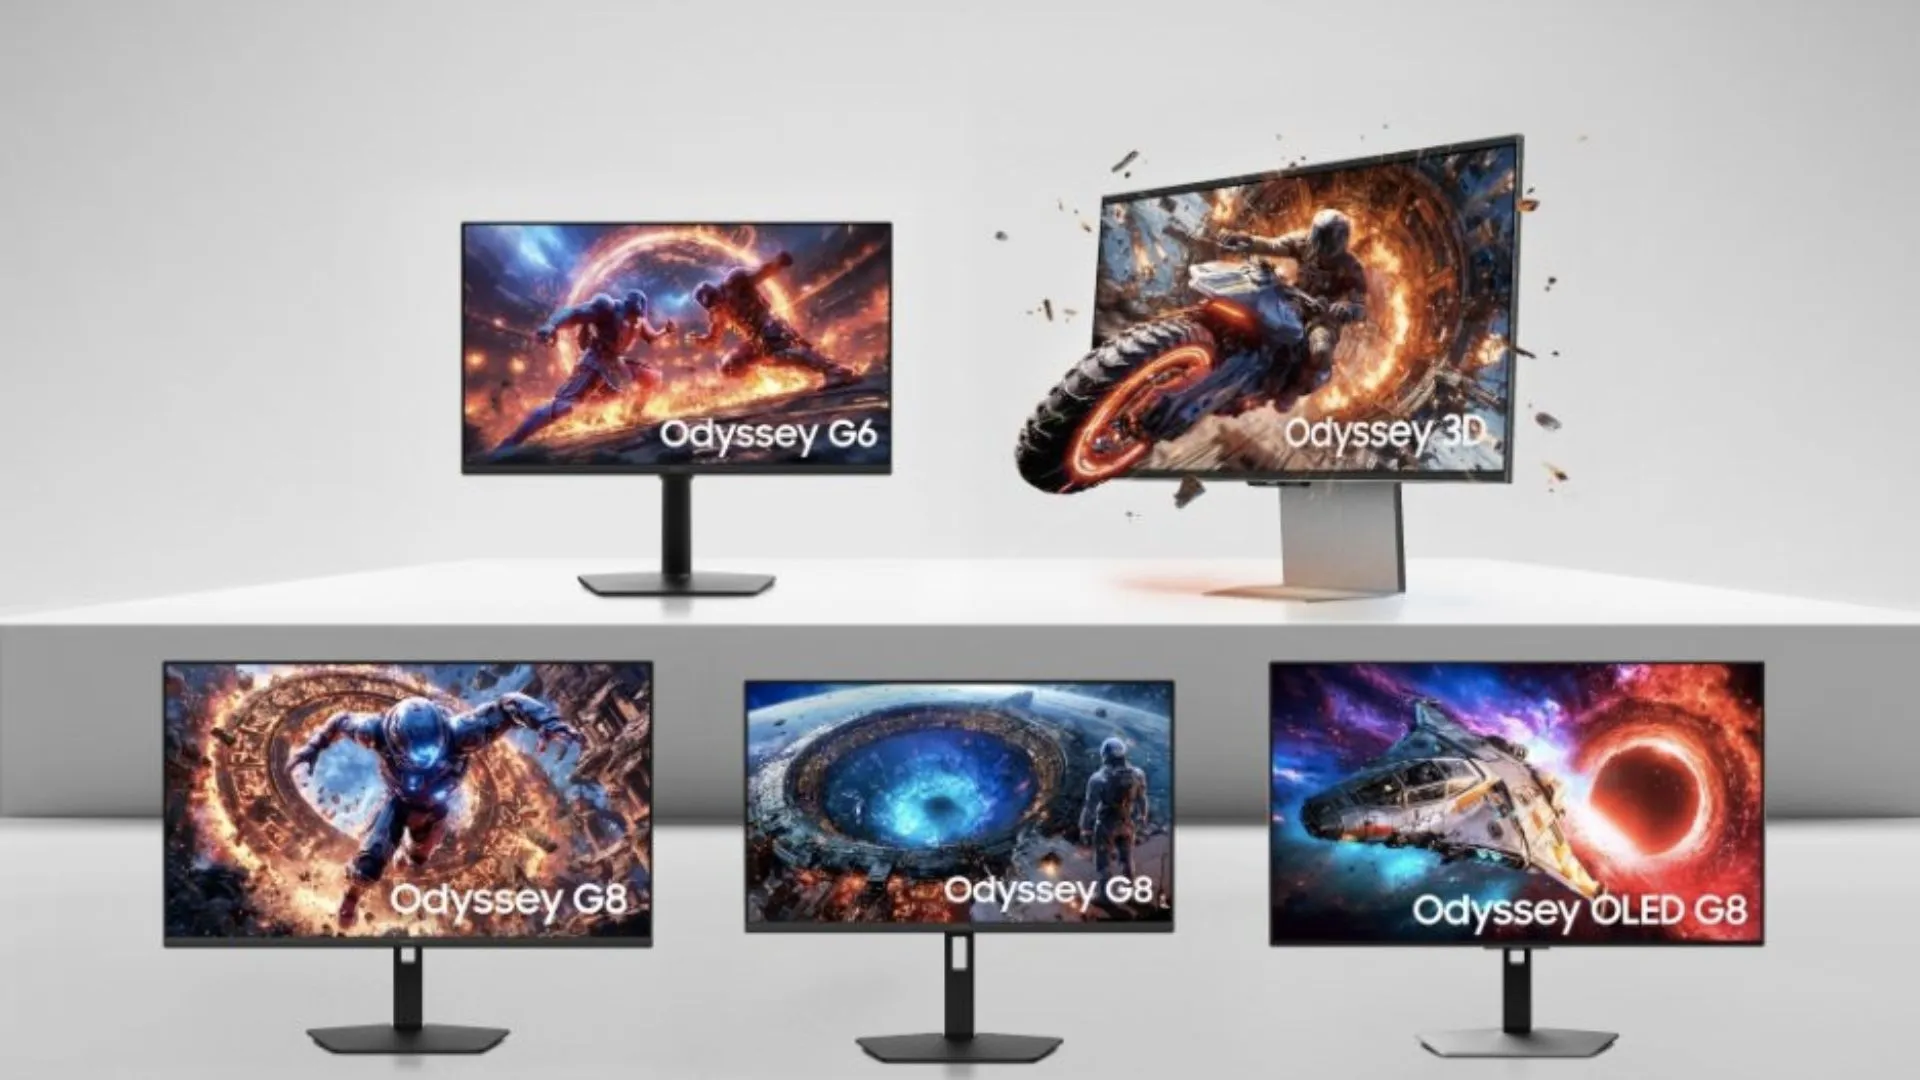
Samsung Electronics has unveiled its new most advanced Odyssey gaming monitor lineup. The lineup includes five new models that push the boundaries of resolution, refresh rates, and immersive visual performance.
Led by Samsung’s first 6K 3D Odyssey G9, the 2026 lineup debuts world-first display technologies for gamers and creators, including the next-generation Odyssey G6 and three new Odyssey G8 models.
First 6K glasses-free 3D monitor
“With this year’s Odyssey lineup, we’re introducing display experiences that simply weren’t possible even a year ago,” said Hun Lee, Executive Vice President of the Visual Display (VD) Business at Samsung Electronics.
“From the industry’s first 6K glasses-free 3D monitor to breakthrough 1,040Hz speed, we designed these monitors to meet the ambitions of today’s gamers and deliver a level of immersion that fundamentally changes how content looks and functions on screen.”
The 32-inch Odyssey 3D (G90XH model) debuts the world’s first 6K display with glasses-free 3D, introducing a new way to experience games on a monitor. Powered by real-time eye tracking, it adjusts depth and perspective in response to the viewer’s position, creating a layered sense of dimension for smooth, uninterrupted gameplay without the need for a headset, according to a press release.
PC gamers can enjoy high-quality expanded lineup
With 6K resolution, a 165Hz refresh rate boosted to 330Hz through Dual Mode, and 1ms response time, fast action stays sharp and smooth, according to Samsung.
The company claims that PC gamers can enjoy a high-quality expanded lineup of supported titles with optimized 3D effects developed in collaboration with game studios. Featured games such as The First Berserker: Khazan, Lies of P: Overture, and Stellar Blade will offer added dimensionality, enhancing terrain, distance, and object separation beyond standard 2D gameplay.
The South Korean company has also highlighted that the 27-inch Odyssey G6 (G60H model) gaming monitor advances competitive gaming with the world’s first 1,040Hz gaming monitor through Dual Mode and native QHD support up to 600Hz, delivering esports-level motion clarity to help players track targets and see fine details during high-speed movement.
When needed, the Odyssey G6 can boost performance in an instant, providing ultra-sharp resolution so viewers can experience breathtaking worlds and ultra-high speeds that fuel competitive adrenaline. With support from both AMD FreeSync Premium and NVIDIA G-Sync Compatible, the Odyssey G6 ensures that every frame is smooth, every color pops, and every moment feels responsive.
The Odyssey G8 series is expanding in 2026 with three distinct models, each offering a different balance of resolution and speed. Leading the lineup, the 32-inch Odyssey G8 (G80HS model), the industry’s first 6K gaming monitor, delivers native 165Hz performance with Dual Mode that supports up to 330Hz in 3K mode.
The 27-inch Odyssey G8 (G80HF model) offers a sharper 5K option with native support up to 180Hz, and Dual Mode boosts to 360Hz in QHD for smoother motion.
For users who want deeper contrast, the 32-inch Odyssey OLED G8 (G80SH model) pairs a 4K QD-OLED panel with a 240Hz refresh rate, Glare Free viewing, 300-nit brightness, and VESA DisplayHDR True Black 500 certification. Its DisplayPort 2.1 (UHBR20) supports up to 80 Gbps of bandwidth for seamless HDR and VRR playback, according to Samsung.
The complete Odyssey 2026 lineup will be on display at CES 2026 in Las Vegas from January 6-9.
Technology
Games of the Future Abu Dhabi 2025 Rewrites the Playbook for Sports with Phygital Innovation
Published on
December 25, 2025
By: Tuhin Sarkar

The Games of the Future Abu Dhabi 2025 have closed an unforgettable chapter in the evolution of phygital sports. Hosted under the patronage of His Highness Sheikh Mohamed bin Zayed Al Nahyan, President of the UAE, the event marked an unparalleled fusion of physical and digital competition. Over six action-packed days, Abu Dhabi hosted more than 850 participants from 60+ countries, with fierce battles across 11 disciplines including Phygital Football, Phygital Basketball, esports, Phygital Fighting, drone racing, and VR gaming.
Games of the Future Abu Dhabi 2025 was not just a sporting event; it was a vision of the future. It set a global standard for what sports can look like in the digital age, where technology and human skill come together to create immersive and multi-dimensional experiences. The competition showed the world that the future of sports isn’t confined to a physical arena, but seamlessly integrates both the physical and digital.
The Champions of Tomorrow: Phygital Sports Takes Centre Stage
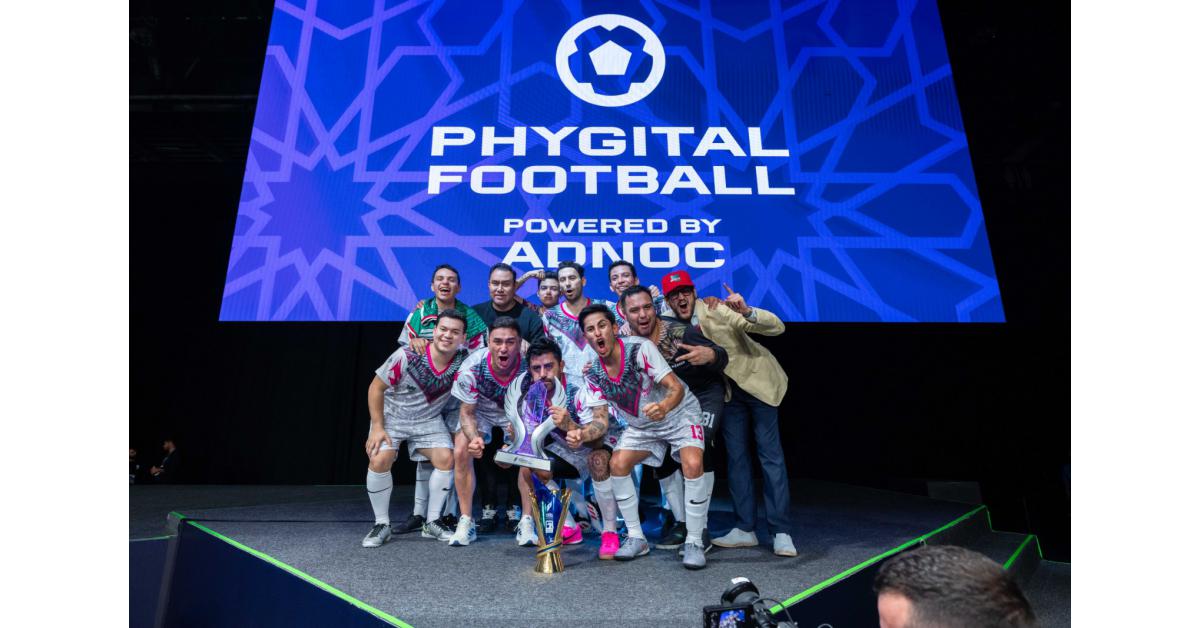
The Games of the Future Abu Dhabi 2025 featured 11 disciplines that blended traditional sports with futuristic technologies, including Phygital Football, Phygital Basketball, esports, Phygital Fighting, and Phygital Shooter. These unique formats tested competitors in both the physical and digital realms. For example, Phygital Football powered by ADNOC saw the México Quetzales – Armadillos FC clinch the Phygital Football title, defeating Troncos FC 2-4 in a thrilling final that captivated crowds throughout the week. Likewise, in Phygital Basketball, the LIGA PRO TEAM triumphed in a 29-23 victory over Moscowsky.
Other high-stakes competitions included Phygital Fighting.FATAL FURY: City of the Wolves, where Kuznya dominated, winning all four of their matches. Meanwhile, xGoat emerged victorious in the Phygital Shooter.CS 2 final, overcoming Dontsu Esports 2-0 in an intense digital shootout.
In the drone racing category, Drone Racing One wowed spectators by completing 50 laps of a challenging circuit, showcasing the high-tech thrill of phygital racing.
A Digital Revolution: The Rise of VR Gaming and Esports
Beyond traditional sports, Games of the Future Abu Dhabi 2025 brought esports and VR gaming into the spotlight. The esports events featured top teams and intense matches across a variety of games, including MOBA Mobile.MLBB and MOBA PC.Dota 2. In a thrilling final, ONIC defeated Aurora Gaming in the Mobile.MLBB championship, while teamWin overcame Vikings 2-0 in Dota 2.
The Battle Royale tournament, featuring Fortnite, saw Kami + Swizzy crush their opponents ZYRO + RAPID in the final. In VR gaming, the HADO competition proved to be one of the most exciting events, where Team Rock claimed the victory.
The digital revolution didn’t stop there—Phygital Dancing.Just Dance was an engaging crowd favorite, with Ivan “myakekcya” Vlasov taking home the crown. These events proved that esports and VR gaming are no longer just niche interests but are now integral parts of mainstream competition.
The Future is Phygital: Tech and Sport in Perfect Harmony
Games of the Future Abu Dhabi 2025 perfectly illustrated how technology and sports are converging to form an entirely new ecosystem. With events such as Phygital Football, Phygital Basketball, and drone racing, the Games were a showcase of the groundbreaking possibilities that arise when sports embrace digital innovations. Technology was not merely an accessory at this event—it was the cornerstone upon which the competitions were built.
With immersive experiences that brought together digital avatars, VR environments, and physical action, the event revealed a new way of experiencing and consuming sports. It also showcased how athletes and fans alike can now engage with sports in ways that were unimaginable just a decade ago.
Abu Dhabi Leads the Way: A Global Hub for Next-Generation Sports
As the host city, Abu Dhabi solidified its position as a global leader in the future of sports. This landmark event wasn’t just about showcasing phygital sports, but also about demonstrating the UAE’s commitment to innovation and technology. The event was a triumph of vision, execution, and global collaboration, bringing together athletes, clubs, and partners from around the world.
In his remarks, Saif Al Noaimi, CEO of Ethara, remarked on the complexity of delivering an event on such a grand scale: “Delivering an event of this scale and complexity required close coordination across multiple disciplines, venues, and partners. The Games of the Future Abu Dhabi 2025 showcased competitive excellence, but also operational innovation and audience engagement at the highest level.”
Similarly, Nis Hatt, CEO of Phygital International, praised the event’s impact: “What we saw over six days was not just competition, but the emergence of a global ecosystem where sport, esports, technology, and innovation coexist on one stage. Abu Dhabi set a new benchmark for scale, delivery, and ambition.”
A Glimpse into the Future: The Global Impact of Phygital Sports
The success of Games of the Future Abu Dhabi 2025 is not just about the event itself. It signals a transformative shift in how we view and experience sports in the 21st century. By embracing phygital sports, the UAE is not just shaping the future of competition, but also setting the stage for the next generation of athletes, fans, and sports industries.
The Phygital Sports Summit, which took place during the event, provided a platform for discussing the future of sports, technology, and innovation. The summit brought together industry leaders, athletes, and tech visionaries to discuss the convergence of physical and digital realms. The dialogue held here will help define the future trajectory of phygital sports and shape the policies that govern it.
Looking Ahead: The Future of Phygital Sports is Now
The Games of the Future Abu Dhabi 2025 wasn’t just a flash in the pan; it was a statement. The event demonstrated how sports and technology can work in harmony, paving the way for the next generation of competition. As Abu Dhabi continues to innovate and lead the way in phygital sports, the rest of the world is watching closely, eager to follow in the footsteps of this global hub for next-generation sports and entertainment.
As Stephane Timpano, CEO of ASPIRE, pointed out, “The success of this edition shows what is possible when vision, technology, and execution align.” The Games of the Future Abu Dhabi 2025 will undoubtedly serve as a springboard for even bigger, more ambitious events in the years to come, setting a new standard for what’s possible in the world of sports.

Technology
The Games of the Future Abu Dhabi 2025 Closes Landmark Edition, Setting New Benchmark for Phygital Sports

GOTF 1

Concludes GOTF.2

Concludes GOTF .3
ABU DHABI, UNITED ARAB EMIRATES, December 25, 2025 /EINPresswire.com/ — The Games of the Future Abu Dhabi 2025 powered by ADNOC concluded on Tuesday after six days of elite competition, innovation, and global participation, marking a milestone moment in the evolution of phygital sports.
Held under the patronage of His Highness Sheikh Mohamed bin Zayed Al Nahyan, President of the UAE, the landmark event brought together more than 850 participants from over 60 countries and featured 11 disciplines, spanning Phygital Football, Phygital Basketball, esports, Phygital Fighting, Phygital Shooter, Phygital drone racing, and VR Game.HADO. Across arenas, stages, and digital battlegrounds, the event showcased how technology and sport are converging to shape the future of competition.
During the globally-watched event, champions were crowned in each discipline, delivering their own defining moments and reinforcing the unique multi-sport identity of the Games of the Future.
Phygital Football powered by ADNOC and Phygital Basketball.3on3 FreeStyle brought to you by M42 both drew vocal crowds throughout the week, with MÉXICO QUETZALES – ARMADILLOS FC taking the Phygital Football title in a thrilling 2-4 final win over Troncos FC, and LIGA PRO TEAM secured the Phygital Basketball title with a 29-23 victory over Moscowsky. Meanwhile, in Phygital Fighting.FATAL FURY: City of the Wolves, Kuznya finished top of the leaderboard after winning all four of their fights, dominating both on the digital stage and in the octagon, and xGoat won the Phygital Shooter.CS 2 final, beating Dontsu Esports 2-0 in the digital world to avoid the need for a deciding round of physical laser tag.
Tasting glory in the esports-focused disciplines, ONIC won the MOBA Mobile.MLBB final against Aurora Gaming, while the aptly-named teamWin beat Vikings 2-0 in the championship game of MOBA PC.Dota 2, and Kami + Swizzy conquered ZYRO + RAPID in the final of the Battle Royale.Featuring Fortnite. In the Phygital Drone Racing presented by InsuranceMarket.ae, which tasked clubs to complete 50 laps of a testing circuit filled with loops, hoops, and straights, Drone Racing One proved fastest on the final day ahead of Team BDS.
A pair of events taking place in the Atrium at ADNEC Centre drew plenty of attention as Ivan “myakekcya” Vlasov triumphed in the Phygital Dancing.Just Dance final, while Team Rock took the title in VR-game.HADO. Lastly, in Battle of Robots, proving itself one of the most spectacular disciplines of the week, Fierce Roc’s menacing Deep Sea Shark machine annihilated Team Cobalt’s Cobalt in a spectacularly destructive finale.
In parallel with the competitive program, the event week also featured an eye-catching and engaging Opening Ceremony and the inaugural Phygital Sports Summit, reinforcing Abu Dhabi’s position as a global hub for next-generation sport, innovation, and immersive entertainment.
Saif Al Noaimi, CEO of Ethara, reflected on intricacy of the Games: “Delivering an event of this scale and complexity required close coordination across multiple disciplines, venues, and partners. The Games of the Future Abu Dhabi 2025 showcased competitive excellence, but also operational innovation and audience engagement at the highest level. We are proud to have played a role in bringing this landmark event to life and in supporting its growth on the global stage.”
Nis Hatt, CEO of Phygital International, said: “The Games of the Future Abu Dhabi 2025 demonstrated how far this movement has come in a short space of time. What we saw over six days was not just competition, but the emergence of a global ecosystem where sport, esports, technology, and innovation coexist on one stage. Abu Dhabi set a new benchmark for scale, delivery, and ambition, and this edition has reinforced the Games of the Future as a defining platform for next-generation competition worldwide.”
Stephane Timpano, CEO of ASPIRE, added: “Hosting the Games of the Future in Abu Dhabi reflects the UAE’s commitment to shaping the future of sport and innovation. This event brought together athletes, clubs, partners, and audiences from around the world. The success of this edition shows what is possible when vision, technology, and execution align, and it positions Abu Dhabi firmly at the forefront of emerging sport formats.”
The Games of the Future Abu Dhabi 2025 is organized by ASPIRE, the Local Delivery Authority, in collaboration with Ethara, the Event Delivery Partner, and Phygital International, the Global Rights Holder. The event is supported by key partners, including Abu Dhabi Sports Council, ADNOC, EDGE, M42, Solutions+, The Galleria, Abu Dhabi Gaming, du Infra, InsuranceMarket.ae, Ministry of Sports, Advanced Technology Research Council, and ADNEC Group.
Deepra Ahluwalia
Action Global Communications
+971 56 477 0995
email us here
Legal Disclaimer:
EIN Presswire provides this news content “as is” without warranty of any kind. We do not accept any responsibility or liability
for the accuracy, content, images, videos, licenses, completeness, legality, or reliability of the information contained in this
article. If you have any complaints or copyright issues related to this article, kindly contact the author above.


BangShift.com IHRA Acquires Heartland Motorsports Park In A Move To Resurrect Yet Another Abandoned Race Track!

Philippine Star – WELCOME TO UBE NATION! 💜 Professional…

Experts say NASCAR likely settled lawsuit for millions

Blum outside hitter takes top honor on Texas 1A all-state volleyball team | Sports

Jeff Gordon reflects on 2025 NASCAR championship, looks to 2026: ‘I’m incredibly optimistic’

Belmont Student-Athletes Have Another Impressive Semester in the Classroom

College Football GMs Became Must-Have in 2025

Rev Your Engines for 2026
Great season for Italian women’s volleyball crowned with the world title – FIVB

Flores Or The Field, Who Has The Edge At 10th Allentown Indoor Series Opener – Speedway Digest

OBITUARY: Judith Lee (Goodwin) O’Leary

Boys Track Small but Mighty at Recent Meet

Blue Bell/TSWA Class 2A All-State Volleyball Team

An open letter to fans of DIVEBOMB Motorsport Magazine

LA Tech Athletics’ Highlight Reel, So Far

SoundGear Named Entitlement Sponsor of Spears CARS Tour Southwest Opener

Donny Schatz finds new home for 2026, inks full-time deal with CJB Motorsports – InForum

Black Bear Revises Recording Policies After Rulebook Language Surfaces via Lever

David Blitzer, Harris Blitzer Sports & Entertainment

How Donald Trump became FIFA’s ‘soccer president’ long before World Cup draw

DeSantis Talks College Football, Calls for Reforms to NIL and Transfer Portal · The Floridian
Elliot and Thuotte Highlight Men’s Indoor Track and Field Season Opener

JR Motorsports Confirms Death Of NASCAR Veteran Michael Annett At Age 39

Rick Ware Racing switching to Chevrolet for 2026

#11 Volleyball Practices, Then Meets Media Prior to #2 Kentucky Match

Colleges ponying up in support of football coaches, programs

23 عاما من الفضائح السياسية والجنسية منذ انقلاب حمد بن خليفة.. استغلال الفتيات الصغيرات في الدعارة.. ضبط ابنة رئيس وزراء قطر خلال ممارستها لجنس الجماعي.. ملامح الحكم تتخبط بين المنفي وتدخلات النساء

Nascar legal saga ends as 23XI, Front Row secure settlement

23 عاما من الفضائح السياسية والجنسية منذ انقلاب حمد بن خليفة.. استغلال الفتيات الصغيرات في الدعارة.. ضبط ابنة رئيس وزراء قطر خلال ممارستها لجنس الجماعي.. ملامح الحكم تتخبط بين المنفي وتدخلات النساء
West Fargo volleyball coach Kelsey Titus resigns after four seasons – InForum


-
 Sports3 weeks ago
#11 Volleyball Practices, Then Meets Media Prior to #2 Kentucky Match
-
 Motorsports3 weeks ago
Nascar legal saga ends as 23XI, Front Row secure settlement
-

 Motorsports3 weeks ago
Sunoco to sponsor No. 8 Ganassi Honda IndyCar in multi-year deal
-

 Sports3 weeks ago
Maine wraps up Fall Semester with a win in Black Bear Invitational
-

 Motorsports2 weeks ago
Ross Brawn to receive Autosport Gold Medal Award at 2026 Autosport Awards, Honouring a Lifetime Shaping Modern F1
-

 Rec Sports3 weeks ago
WNBA’s Caitlin Clark, Angel Reese and Paige Bueckers in NC, making debut for national team at USA camp at Duke
-

 NIL3 weeks ago
Nike Signs 10 LSU Athletes to NIL deals
-

 Rec Sports2 weeks ago
Stempien to seek opening for Branch County Circuit Court Judge | WTVB | 1590 AM · 95.5 FM
-

 Motorsports3 weeks ago
Rick Hendrick comments after the NASCAR lawsuit settlement
-
Sports3 weeks ago
Wisconsin defeats Stanford in NCAA regional semifinals: Updates, recap