
Technology
SNAPCHAT AND RWS GLOBAL TEAM UP ON IN-STADIUM AUGMENTED REALITY EXPERIENCES AT GLOBAL SPORTING EVENTS

C$532M After-Tax NPV5%, C$175M Initial Capital, Adjacent to Multiple Mills, Still Growing
Radisson Mining Resources Inc. (TSXV: RDS,RMRDF) (OTCQB: RMRDF) (“Radisson” or the “Company”) is pleased to announce a positive Preliminary Economic Assessment (the “PEA”) for the O’Brien Gold Project (“O’Brien” or the “Project”) located in the Abitibi region of Québec. Highlights are as follows (all figures are in Canadian dollars and troy ounces unless noted):
Basis of Study:
- Assumes off-site toll milling based on the results of a recent milling assessment and metallurgical study that demonstrated the potential compatibility of the nearby Doyon gold mill, part of IAMGOLD Corporation’s (“IAMGOLD“) Westwood Mine Complex1. Off-site milling reduces capital costs, development risk, and project footprint.
- Utilizes existing Mineral Resource Estimate (“MRE“), re-blocked with an updated cut-off yielding more ounces in more tonnes with good continuity at a lower average grade.
- Presents a base case “snap-shot” study that excludes recent drilling successes outside the existing MRE and below historic mine workings, with a 50-60,000 metre (m) fully funded drill program ongoing.
Value:
- After-tax Net Present Value at a 5% discount rate (“NPV5%“) of $532 million (“M”), Internal Rate of Return (“IRR”) of 48%, and payback of 2.0 years at US$2,550/oz gold (“Au”).
- After-tax NPV5% of $871M, IRR of 74%, and payback of 1.1 years at US$3,300/oz Au.
Cost:
- Initial Capital Cost (“Capex”) of $175M and Life-of-Mine Sustaining Capital of $173M
- Cash Cost2 of US$861/oz and All-In Sustaining Cost1 (“AISC”) of US$1,059/oz including conceptual 30% toll milling margin on processing and G&A costs.
- Extremely capital efficient with after-tax NPV5% to Initial Capital Cost ratio of 3.0 at US$2,550/oz Au and 5.0 at a spot gold price of US$3,300/oz Au.
Production Profile:
- 11-Year Mine Life with 740 koz mined and 647 koz recovered at 87% average recovery with a gravity-flotation-regrind-leach flowsheet.
- 70 koz/annum average steady-state gold production (Years 2-8) at an average annual after-tax Free Cash Flow (“FCF”) of $97M.
- Underground mining with long-hole stoping and minimal surface facilities.
Radisson will host a technical webinar on the O’Brien PEA on Wednesday July 9, 2025 at 11am ET (8am PT). Participants may register here. A recording will be available following the webinar.
Matt Manson, President & CEO, commented: “We are pleased to be reporting today the first modern mining study for the O’Brien Gold Project. This PEA builds upon the milling assessment completed earlier this year that demonstrated the potential viability of processing O’Brien mined material at a neighbouring mill. The result is a low cost and high value project should a beneficial milling arrangement be secured. By taking advantage of existing infrastructure in the region, the study surfaces considerable value for O’Brien while minimizing its environmental impact. The extremely high NPV5% to cost ratio demonstrates the efficient allocation of capital that this approach offers.
“Rather than high-grading the deposit, as was the case with the historic O’Brien Mine, the PEA is developed from the existing MRE with a lower cut-off, yielding more ounces, more tonnes and better mining continuity at lower average grades. From that starting point, we are presenting a fully underground mine plan, right sized at 1,200 tonnes per day (“tpd”) and optimized at a cautious US$2,000/oz gold price assumption, delivering 740,000 ounces of gold to the mill at high margins over an 11-year life. The O’Brien Gold Project’s legacy of high grades and visible gold continues to be an attribute of the current mine design and the ongoing exploration.”
Pierre Beaudoin, Chairman of the Board of Directors, commented: “The PEA announced today is a significant step forward for Radisson. The study outlines a credible mine plan and development strategy for O’Brien, offering shareholders significant value even on the existing mineral resources. This is also just a snap-shot of a project that is continuing to grow. The ongoing drill program is demonstrating impressive new gold mineralization outside the scope of this initial mine design. On the basis upon which the PEA is developed, we believe a significantly larger mineral inventory exists to our exploration horizon of 2,000 m depth. Recent drill results are supporting this thesis.”
Matt Manson continued: “We see in O’Brien a broad system of mineralization with significant scale potential. Our current focus at Radisson is to maximize this potential through the recently expanded drill program and our strong treasury. Today’s PEA, however, establishes a project development path that is practical and highly rewarding. We intend to further pursue this path with environmental baseline studies, additional engineering and mine plan optimization, community consultation, and dialog with potential processing partners.”
VIDEO: President & CEO Matt Manson comments on today’s news
O’Brien Gold Project Preliminary Economic Assessment
The PEA was completed by Ausenco Engineering Canada ULC (“Ausenco”) as lead consultant with specific responsibility for metallurgy, processing design, infrastructure and financial modelling. InnovExplo (a member of Norda Stelo Inc.; “Norda Stelo”) completed the mine design and mine scheduling, BBA Inc. were responsible for water management, surface facilities, and a review of the Project’s environmental assessment procedure and permitting requirements, and SLR Consulting (Canada) Ltd. (“SLR”) were responsible for the MRE.
The PEA is a companion study to a recently completed milling assessment for the Project in which a metallurgical program was conducted with representative samples of mineralized core from O’Brien. The samples were tested based on a series of flow sheet options which would conceptually be compatible with the nearby Doyon gold mill, part of IAMGOLD’s Westwood Mine Complex, with minimal adjustment to the existing Doyon mill configuration. The milling assessment was conducted under a Memorandum of Understanding (“MOU“) with IAMGOLD (Radisson news release dated September 9, 2024). The MOU is non-binding and non-exclusive and contains no specific terms around potential commercial arrangements between the parties. The PEA has been completed independently by Radisson and establishes criteria for the development of O’Brien based on processing and tailings management at an existing off-site facility under a toll milling arrangement.
Cautionary statement: Readers are cautioned that the PEA is preliminary in nature, it includes inferred mineral resources that are considered too speculative geologically to have economic considerations applied to them that would enable them to be categorized as mineral reserves, and there is no certainty that the PEA will be realized.
Table 1: Summary of Key Results and Assumptions in the PEA
| Production Datanote 1 | Values | Units | |
| Life-of-Mine | 11 | Years | |
| Total Resource Mined | 4,575 | kt | |
| Total Waste Mined | 3,314 | kt | |
| Average Head Grade | 5.0 | g/t Au | |
| Contained Gold | 740 | koz | |
| Recovered Gold | 647 | koz | |
| Average Gold Recovery | 87% | ||
| Years 2-8: Steady State Run-Ratenote2 | Average Production Mining Rate | 1,160 | tpd |
| Average Annual Gold Production | 70 | koz | |
| Average Head Grade | 4.9 | g/t Au | |
| Annual Average After-Tax Free Cash Flow | $97 | C$M | |
| Capital Costsnote 1 | Values | Units | |
| Initial Capital | $175 | C$M | |
| Sustaining Capital (Excluding Closure) | $173 | C$M | |
| Capital Intensity (Initial Capital/oz milled) | $172 | US$/oz | |
| Life-of-Mine Operating Costsnotes 1,3 | Values | Units | |
| Miningnote 3 | $76 | C$/t milled | |
| Processing | $38 | C$/t milled | |
| G&A | $31 | C$/t milled | |
| 30% Processing Toll note 4 | $19 | C$/t milled | |
| Total Operating Cost | $163 | C$/t milled | |
| Refining & Transport | $6 | US$/oz | |
| Royalties | $10 | C$M | |
| Total Cash Cost | $861 | US$/oz | |
| All-In Sustaining Costnote 5 | $1,059 | US$/oz | |
| Financial Analysisnote 1 | Values | Units | |
| Gold Price for Financial Analysis | $2,550 | US$/oz | |
| US$:C$ Exchange | $0.73 | ||
| Pre-Tax NPV5% | $782 | C$M | |
| Pre-Tax IRR | 65% | ||
| Pre-Tax Payback | 1.4 | years | |
| After-Tax NPV5% | $532 | C$M | |
| After-Tax IRR | 48% | ||
| After-Tax Payback | 2.0 | years | |
| Mine Revenue | $2,258 | C$M | |
| EBITDA | $1,496 | C$M | |
| EBITDA Margin | 66% | ||
| Pre-Tax Unlevered Free Cash Flow | $1,146 | C$M | |
| After-Tax Unlevered Free Cash Flow | $803 | C$M | |
Notes:
- Denotes a “specified financial measure” within the meaning of NI 52-112. See note on “Non-IFRS Financial Measures”.
- Represents full calendar years
- LOM operating costs includes cash operating costs during the initial capital period. Mining operating costs exclude waste development costs and mobile equipment costs which are captured as sustaining capital items
- Processing toll milling charges are conceptual and have been estimated by Ausenco based on recent industry precedent
- AISC includes Royalties, Total Cash Costs and Sustaining Capital, including closure costs. Excludes corporate G&A.
Mineral Resources
The MRE for the Project was originally disclosed in March 2023 (Radisson news release dated March 2, 2023) based on 325,509 m of drilling completed to the end of 2022 and authored by SLR. Indicated Mineral Resources were estimated at 0.50 million ounces (1.52 million tonnes at 10.26 g/t Au) with additional Inferred Mineral Resources of 0.45 million ounces (1.60 million tonnes at 8.66 g/t Au). The 2023 study utilized a 4.5 g/t Au cut-off at US$1,600/oz Au with certain assumptions for minimum mining width, mining costs, C$:US$ exchange and metallurgical recovery. Mineral Resources that are not Mineral Reserves do not have demonstrated economic viability.
For the purposes of the PEA, the 2023 block model was re-blocked by SLR in the Z-direction to 5 m to allow for more flexible underground mine design, and an updated cut-off and set of economic criteria were applied consistent with Deswick Stope Optimizer (“DSO”) parameters used for the optimization of the underground mine schedule and the Project’s recent milling assessment. The MRE now utilizes a cut-off of 2.2 g/t Au at US$2,000/oz Au. No other changes were made. This has the effect of increasing tonnage and ounces and decreasing average grade compared to the previous estimate (Table 2).
Table 2: Mineral Resource Estimate Using a 2.2 g/t Au Cut-Off and US$2,000/oz Gold Price
(Numbers in Italics Represent Changes from the MRE based on a 4.5 g/t Au Cut-Off and US$1,600/oz Gold Price.)
| Category | Tonnes (kt) | Grade (g/t Au) | Oz (koz Au) | |||
| Indicated | 2,204 | +45% | 8.2 | -20% | 582 | +16% |
| Inferred | 6,671 | +317% | 4.4 | -50% | 932 | +109% |
Notes:
- Prepared in accordance with the Canadian Institute of Mining, Metallurgy and Petroleum (CIM) Definition Standards (2014) and Best Practice Guidelines of Mineral Resources and Reserves (2019).
- Mineral Resources are reported above a cut-off grade of 2.2 g/t Au based on a C$172.5/t operating cost.
- Mineral Resources are estimated using a long-term gold price of US$2,000/oz Au, a US$:C$ exchange rate of 1:1.33, and a metallurgical recovery of 90%.
- Wireframes were modelled at a minimum width of 1.2 m.
- Bulk density varies by deposit and lithology and ranges from 2.00 t/m³ to 2.82 t/m³.
- Full length composites were capped 40 g/t Au.
- Mineral Resources that are not Mineral Reserves do not have demonstrated economic viability.
- Numbers may not add due to rounding.
Between the end of 2022 and the present, Radisson completed approximately 50,000 m of additional drilling at the Project. Drilling that was completed within the volume of the MRE is assessed to have no material impact on the overall contained mineral resource, such that the MRE is appropriate in SLR’s opinion for mine planning. Drilling that was completed outside the volume of the MRE, including below the level of the historic mine workings at O’Brien, has indicated the presence of significant additional gold mineralization that is not incorporated in the current conceptual mine plan. Radisson expects to complete a further 50,000-60,000 m of drilling in 2025 and 2026, at which time the Company expects to complete an updated MRE.
Mining
The PEA describes an 11-year mine life based on the mining of 4.57 Mt of mineralized material and 3.31 Mt of waste rock (Table 3). Mining will be fully underground with long-hole stoping and a cemented rock backfill. Stope design is benefitted by good spatial continuity of reported resource blocks at the lower cut-off grade. Minimum and average stope widths are 2.2 m and 2.7 m respectively, including 0.7 m of planned dilution. The mine will be accessed by way of twin 4.5 m by 4.5 m ramps from surface to a depth of 950 m with 86 kilometres (km) of development. Mining equipment includes 20 tonne trucks with rock haulage assisted by vertical conveyors delivering mined material from the 300 m level to a surface run-of-mine pad. The underground mine design does not incorporate any infrastructure from the historic O’Brien Mine. A shaft at the historic Kewagama Mine site east of O’Brien will be reused for ventilation. Mined material will be trucked by road for processing.
Table 3: Mined Material
| Material | Tonnes (kt) |
Oz (koz Au) |
Head Grade (g/t Au) |
| Production Stopes | 3,146 | 588 | 5.8 |
| Marginal Stopes | 169 | 16 | 2.9 |
| Development | 469 | 91 | 6.0 |
| Low-Grade Development | 790 | 45 | 1.8 |
| Total Mineralized Mined Material | 4,575 | 740 | 5.0 |
| Waste | 3,314 | n/a | n/a |
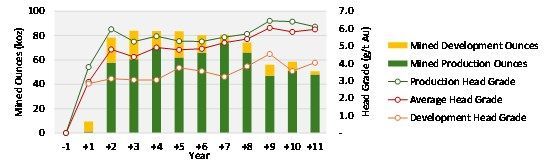
Figure 1: Annual Average Production Schedule
To view an enhanced version of this graphic, please visit:
https://images.newsfilecorp.com/files/10977/258183_1e2a85bb743ed9d7_002full.jpg
The underground mine was designed and production scheduled on the basis of a DSO optimization at US$2,000 Au and production cut-off grades of 3.05 g/t Au and 3.11 g/t Au depending on the royalty to be considered. “Mined Material” is categorized as Production Stope Material, Marginal Stope Material, Development Material, Low-Grade Development Material and Waste. In Years 2-8 during which the Project maintains steady-state operation, production from stopes averages 1,160 tpd. However, the PEA contemplates up to 2,000 tpd of mill capacity. Consequently, all mineralized mined material is scheduled for processing (Figure 1), resulting in an average head grade of 5.0 g/t Au, delivering an average of 1,410 tonnes of mined material daily to the mill, and eliminating the requirement for a low-grade stockpile.
Mineral Resources not included in the mine plan are those considered too isolated or too marginal at a US$2,000/oz DSO optimization. The mine design also excludes Mineral Resources located in the former Thompson Cadillac mine area or in areas considered too close to the historic workings. The quantity of mineralized mined material in the mine design is highly sensitive to the gold price assumption, with the DSO optimization delivering significantly more mined material in both existing production stopes and development areas, as well new stopes and development areas, at higher gold prices.
Infrastructure and Site Facilities
The Project is located adjacent to the Trans-Canada Highway 117 and has existing road access to the historic O’Brien mine site. The PEA contemplates twin underground mine portals located 2 km to the east of the historic site, with new haul roads, a waste rock pad, a run-of-mine pad, laydown areas, the surface installation of a vertical conveyor, trenches and sumps for water management, and a waste-water treatment plant. The PEA does not contemplate a mill, tailings deposition, accommodation camp, or major maintenance facilities. Small vehicle maintenance and site offices/mine dry will be provided from existing facilities or temporary modules. A new substation will derive power from the adjacent 112 kV high voltage transmission line operated by Hydro-Québec.
Processing(See footnote 1)
The PEA contemplates processing and tailings deposition at an off-site facility. To assess the viability of this scenario, Radisson conducted a metallurgical study and milling assessment under the auspices of an MOU with IAMGOLD to assess the design criteria for processing O’Brien mined material at the nearby Doyon gold mill, the processing facility for IAMGOLD’s Westwood Mine Complex. The Doyon mill is located 21 km west of O’Brien and directly accessible along Trans-Canada Highway 117.
The metallurgical results of this milling assessment were previously reported (see Radisson news release dated February 3, 2025) and are incorporated into the PEA. Gold recoveries of between 86% and 96% were obtained based on a series of flow sheet options, all of which are compatible with the Doyon mill with minimal or modest additional capital. The metallurgical program was undertaken at the Lakefield, Ontario facilities of SGS Canada Inc. under the supervision of Ausenco.
The Doyon mill currently operates at approximately 3,000 tpd with a conventional cyanidation process. Mined material is processed with a primary crusher and a two-stage semi-autogenous SAG mill/Ball mill grinding at 75 µm (P80). Leaching is by way of two stage Carbon-in-Leach and Carbon-in-Pulp circuits. The PEA contemplates a Gravity-Flotation-Regrind-Leach flow sheet and assumes Radisson deploying $21M of capital to upgrade the gravity and flotation circuits at Doyon that have been used previously but are currently inactive.
The Doyon mill currently processes approximately 1,000 tpd from the underground Westwood mine and approximately 2,000 tpd from the nearby Grand Duc open pit. Processing of Grand Duc material is estimated to be completed in early 2027, as outlined in the Westwood Mine Complex technical report dated September 30, 2024. Hence, the PEA envisions up to 2,000 tpd of mill capacity available for O’Brien at Doyon, allowing for the direct shipment of both production material and lower grade development material at an average of 1,400 tpd. The PEA does not anticipate the stockpiling of low-grade mined material at the O’Brien site, resulting in a significant cost saving.
Life-of-mine average gold recovery with the Gravity-Flotation-Regrind-Leach flowsheet is estimated at 87%. This is based on 90% recovery for the O’Brien metallurgical sample at an average grade of 6.3 g/t Au and the application of a grade-recovery model to the average head-grade expected in the PEA of 5.0 g/t Au after the processing of low-grade development materials.
O’Brien gold mineralization is associated with pyrite and arsenopyrite. The metallurgical program determined average arsenic values of 0.4% to 0.5% in whole rock, relevant if material is being sent to tailings deposition on-site, and 4.6% in flotation concentrate, relevant if a concentrate is being sold to an off-take agent. These values are consistent with precedent projects in Québec’s Abitibi and offtake threshold limits for concentrates of high-grade gold projects. The PEA contemplates tailings deposition after leach without a segregated tailings impoundment. If one is required, additional capital expenses would be incurred.
The PEA contains estimates of operating and capital costs for trucking, processing, tailings management and G&A developed by Ausenco from first principles based on the metallurgical results and precedent projects. These costs correspond well to recently reported operating results from the Doyon facility. The PEA’s financial results reflect an additional 30% charge on processing and G&A costs, corresponding to approximately $19/t, to reflect the impact of a potential toll milling charge. The MOU between Radisson and IAMGOLD contains no specific terms around potential commercial arrangements between the Parties, including the use of the Doyon mill or the terms of potential toll-milling. There is no certainty that any arrangement between the Parties will result from their dealings pursuant to the MOU, which is non-binding and non-exclusive.
Capital and Operating Costs(See footnote 1)
Initial Capital costs (Table 4) are estimated at $175M and reflect costs incurred during a 21-month period of early works, mill modification and principal mine construction to the end of the first quarter of Year 2 and the attainment of commercial production. The Initial Capital cost estimate excludes both pre-production mine operating costs and revenue, which are reflected in the Life-of-mine operating cost and revenue estimates, and excludes development costs incurred prior to the commencement of early works. Contingencies on individual capital line items in the underground mine design are at 15%, developed within the material, productivity and cost estimates. Contingencies on non-underground mine items, and on mill modifications and surface facilities, are at 25%.
Life-of-mine Sustaining Capital costs are estimated at $173M and reflect capital costs incurred after the first quarter of Year 2, including underground mine development costs in waste rock and underground mine infrastructure, but excluding mine closure and salvage. Mobile mining equipment is scheduled to be purchased in installments, and is represented as Initial Capital, to the extent that a payment or deposit occurs within the project construction period, and as Sustaining Capital to the extent it occurs during the operating phase.
Table 4: LOM Capital Costs
| Itemnote 1,2 | Cost (C$M) |
| Mining Capex | $93 |
| Mobile Equipment | $25.7 |
| Mine Development | $47.4 |
| Buildings | $0.4 |
| Mine Services | $19.7 |
| Process Plant | $21 |
| Flotation | $4.5 |
| Regrind | $14.1 |
| Reagents | $2.0 |
| Onsite Infrastructure | $16 |
| Offsite Infrastructure | $8 |
| Indirects | $14 |
| Owners Costs | $4 |
| Cash Contingency | $20 |
| Total Initial Capital | $175 |
| Sustaining Capital | $173 |
| Closure | $5 |
| Salvage | $(3) |
| Total | $ 350 |
Notes:
- Denotes a “specified financial measure” within the meaning of NI 52-112. See note on “Non-IFRS Financial Measures”.
- Columns may not sum exactly due to rounding.
Mining, haulage and water management operating costs (Table 5) are estimated at $75.66/t milled (LOM). These are developed by Norda Stelo from first principles based on recent precedent projects with similar mining methodologies and location. Total life-of-mine mining costs, including mining related Initial Capital, Sustaining Capital and Operating costs are $581M, or $127/t milled. Processing and G&A cost estimates are developed by Ausenco from first principles based on the results of the milling assessment conducted at the Doyon mill and based on recent precedent projects. Toll Milling Charges are conceptual and have been estimated by Ausenco based on recent industry precedent.
Total Cash Costs are US$861/oz with AISC of US$1,059/oz (LOM). AISC³ during the steady-state operations of Years 2-8 is estimated at US$1,106/oz.
Table 5: Life-of-Mine Operating Costs and AISC
| Itemnote1,2 | Value | Units |
| Mining, Haulage and Water Management | $346 | C$M |
| $75.66 | C$/t milled | |
| Processing & Tailings Treatment | $173 | C$M |
| $37.71 | C$/t milled | |
| Process Toll note3 | $87 | C$M |
| $18.94 | C$/t milled | |
| G&A | $142 | C$M |
| $31.06 | C$/t milled | |
| Total | $747 | C$M |
| $163.38 | C$/t milled | |
| Off-Site Costs, Refining and Transport | $6 | C$M |
| Royalties | $10 | C$M |
| Total Cash Costs | $861 | US$/oz Au |
| Sustaining, Closure, Salvage Capital | $197 | US$/oz Au |
| Total AISCnote4 | $1,059 | US$/oz Au |
Notes:
- Denotes a “specified financial measure” within the meaning of NI 52-112. See note on “Non-IFRS Financial Measures”.
- Columns may not sum exactly due to rounding.
- Conceptual and estimated based on recent industry precedent.
- AISC includes Royalties, Total Cash Costs and Sustaining Capital, including closure costs and corporate G&A.
Financial Analysis
At a long-term consensus gold price of US$2,550 and an exchange rate of 0.73 (US$/C$) the Project generates an after-tax NPV5% of $532M and IRR of 48% (unlevered; Table 6). Payback on initial capital is 2.0 years. The Project’s valuation is discounted to Year -0.5 when early works would be scheduled to commence.
Table 6: Valuation Sensitivities to the Gold Price (after-tax, unlevered)
| Gold Price (US$/oz) Price Case |
$1,800 Downside | $2,200 | $2,550 Base Case |
$3,000 Upside |
$3,300 Spot |
$4,000 | |
| After Tax NPV (C$M) | 0% | $340 | $587 | $803 | $1,081 | $1,266 | $1,698 |
| 3% | $244 | $448 | $626 | $856 | $1,009 | $1,366 | |
| 5% | $193 | $374 | $532 | $736 | $871 | $1,188 | |
| 8% | $134 | $286 | $419 | $591 | $705 | $971 | |
| 10% | $102 | $239 | $358 | $512 | $614 | $853 | |
| IRR | 21% | 35% | 48% | 64% | 74% | 100% | |
| NPV5%/Capex | 1.1 | 2.1 | 3.0 | 4.2 | 5.0 | 6.8 | |
| Paybacknote 2 | Years | 4.3 | 2.7 | 2.0 | 1.4 | 1.1 | 0.7 |
| Total After Tax FCFnote1, 3 | C$M | $340 | $587 | $803 | $1,081 | $1,266 | $1,698 |
| Average Annual FCFnote1, 4 | C$M | $48 | $74 | $97 | $127 | $147 | $194 |
Notes:
- Denotes a “specified financial measure” within the meaning of NI 52-112. See note on “Non-IFRS Financial Measures”.
- Payback is defined as achieving cumulative positive free cashflow after all cash costs and capital costs, including sustaining.
- Calculated LOM, unlevered.
- Calculated for Years 2-8 of steady state production, unlevered.
LOM EBITDA is estimated at $1.5 billion (“B”), with an effective EBITDA margin of 66%. LOM after-tax FCF is estimated at $0.8B on an unlevered basis. Annual average after-tax FCF during the steady-state operations of Years 2-8 is estimated at $97M. The Project is forecast to generate federal and provincial income taxes and mining duties of $343M.
At spot gold of US$3,300/oz gold, the Project generates an after-tax NPV5% of $871M, IRR of 74%, and payback on initial capital of 1.1 years. The Project is cash positive after-tax at gold prices above US$1,260/oz.
The Project is most sensitive to revenue attributes such as gold price, head grade and exchange rate, followed by operating cost and capital cost (unlevered; Table 7). Valuation sensitivities on conceptual toll-milling charges expressed as margins on processing and G&A costs of between 0% and 60%. At 0% toll, the Project has an after-tax NPV5% of $578M and IRR of 52% (unlevered; Table 8).
A 2% Net Smelter Royalty (“NSR”) is applied on gold production on certain claims on the easternmost portion of the property in the favour of Globex Mining Enterprises Inc., covering approximately 22% of the scheduled gold production.
Table 7: Valuation Sensitivities to Certain Operating Parameters (after-tax, unlevered)
| Factor | -20% | -10% | 0% | 10% | 20% | |
| Operating Cost | IRR | 55% | 51% | 48% | 44% | 40% |
| NPV5% | $611 | $572 | $532 | $493 | $454 | |
| Initial Capital Cost | IRR | 57% | 52% | 48% | 44% | 41% |
| NPV5% | $557 | $545 | $532 | $520 | $508 | |
| 0.65 | 0.70 | 0.73 | 0.80 | 0.85 | ||
| $C:$US F/X | IRR | 59% | 52% | 48% | 40% | 35% |
| NPV5% | $674 | $582 | $532 | $432 | $370 |
Table 8: Project Sensitivity to Potential Toll-Milling Charges (after-tax, unlevered)
| Toll Margin | 0% | 30% | 60% |
| IRR | 52% | 48% | 44% |
| NPV5% | $578M | $532M | $487M |
Cautionary statement: Readers are cautioned that the PEA is preliminary in nature, it includes inferred mineral resources that are considered too speculative geologically to have economic considerations applied to them that would enable them to be categorized as mineral reserves, and there is no certainty that the PEA will be realized.
Permitting and Environmental Assessment
The Project is located within the Abitibi-Témiscamingue region of Québec in the township of Cadillac, part of the municipality of Rouyn-Noranda. First Nations (“FN”) within the Project’s expected area of expected economic and social influence are the Pikogan FN (Abitibiwinni) and Long Point FN (Anishinabeg). BBA Inc. were retained to provide a roadmap for social and environmental assessment and mine permitting based on the project scope presented in the PEA. A 3.5-year process of environmental assessment, technical studies, community consultation and permitting is anticipated prior to the commencement of mine construction. The Project is subject to the Québec Environmental Quality Act (“EQA”) and, following changes to the EQA proposed in the November 2024 Act to Amend the Mining Act and Other Provisions, is expected to be subject to a Québec Environmental Impact Assessment and Review. The Project is not expected to be subject to a Federal Impact Assessment procedure but will be subject to the Metal and Diamond Mining Effluent Regulations (Fisheries Act).
NI 43-101 Technical Report
Radisson will file a Technical Report prepared in accordance with the requirements of National Instrument 43-101 – Standards of Disclosure for Mineral Projects (“NI 43-101”) for the O’Brien Gold Project Preliminary Economic Assessment on SEDAR+ on or before August 21, 2025.
Qualified Persons
Disclosure of a scientific or technical nature in this news release was prepared under the supervision of Mr. Richard Nieminen, P.Geo, (QC), a geological consultant for Radisson and a Qualified Person for purposes of NI 43-101. Mr. Nieminen is independent of Radisson and the O’Brien Gold Project.
Renée Barrette of Ausenco Engineering Canada ULC, is the Qualified Person responsible for the preparation of the Project’s milling assessment, PEA metallurgy, and for PEA financial model which is based on capital costs, operating costs, and the mining cost provided by other parties.
Mr. Luke Evans, M.Sc., P.Eng., ing, of SLR Consulting (Canada) Ltd., is the Qualified Person responsible for the preparation of the MRE at O’Brien.
Mr. Marc R. Beauvais, P.Eng. of InnovExplo, a member of Norda Stelo, is the Qualified Person responsible for the mine design and mine scheduling.
Mr. Hugo Latulippe of BBA is the Qualified Person responsible for the permitting, environmental, social, water management and closure cost estimate.
Each of Mr. Nieminen, Ms. Barrette, Mr. Evans, Mr. Beauvais and Mr. Latulippe have reviewed and approved the technical information contained in the PEA and in this press release in their area of expertise and are considered to be “independent” of Radisson and the O’Brien Gold Project for purposes of NI 43-101.
Non-IFRS Financial Measures
The Company has included various references in this document that constitute “specified financial measures” within the meaning of National Instrument 52-112 Non-GAAP and Other Financial Measures Disclosure of the Canadian Securities Administrators, such as, for example, Free Cash Flow, EBITDA, Total Cash Cost and All-In Sustaining Cost. None of these specified measures is a standardized financial measure under International Financial Reporting Standards (“IFRS”) and these measures might not be comparable to similar financial measures disclosed by other issuers. Each of these measures are intended to provide additional information to the reader and should not be considered in isolation or as a substitute for measures prepared in accordance with IFRS. Certain non-IFRS financial measures used in this news release and common to the gold mining industry are defined below.
Total Cash Cost and Total Cash Cost per Ounce
Total Cash Cost is reflective of the cost of production. Total Cash Cost reported in the PEA include mining costs, processing & water treatment costs, general and administrative costs of the mine, off-site costs, refining costs, transportation costs and royalties. Total Cash Cost per Ounce is calculated as Total Cash Cost divided by payable gold ounces.
All-in Sustaining Cost (AISC) and AISC per Ounce
AISC is reflective of all of the expenditures that are required to produce an ounce of gold from operations. AISC reported in the PEA includes total cash costs, sustaining capital, expansion capital and closure costs, but excludes corporate general and administrative costs and salvage. AISC per Ounce is calculated as AISC divided by payable gold ounces.
Free Cash Flow (FCF)
FCF deducts capital expenditures from net cash provided by operating activities. Management believes this to be a useful indicator of our ability to operate without reliance on additional borrowing or usage of existing cash. Free cash flow is intended to provide additional information only and does not have any standardized definition under IFRS and should not be considered in isolation or as a substitute for measures of performance prepared in accordance with IFRS. The measure is not necessarily indicative of operating profit or cash flow from operations as determined under IFRS. Other companies may calculate this measure differently.
Earnings Before Interest, Taxes, Depreciation and Amortization (EBITDA)
EBITDA excludes from net earnings income tax expense, finance costs, finance income and depreciation. Management believes that EBITDA is a valuable indicator of our ability to generate liquidity by producing operating cash flow to fund working capital needs, service debt obligations, and fund capital expenditures. Management uses EBITDA for this purpose.
About Radisson Mining
Radisson is a gold exploration company focused on its 100% owned O’Brien Gold Project, located in the Bousquet-Cadillac mining camp along the world-renowned Larder-Lake-Cadillac Break in Abitibi, Québec. A July 2025 Preliminary Economic Assessment described a low cost and high value project with an 11-year mine life and significant upside potential based on the use of existing regional infrastructure. Indicated Mineral Resources are estimated at 0.58 million ounces (2.20 million tonnes at 8.2 g/t Au), with additional Inferred Mineral Resources estimated at 0.93 million ounces (6.67 million tonnes at 4.4 g/t Au). Please see the NI 43-101 “Technical Report on the O’Brien Project, Northwestern Québec, Canada” effective March 2, 2023 and other filings made with Canadian securities regulatory authorities available at www.sedarplus.ca for further details and assumptions relating to the O’Brien Gold Project.
Forward-Looking Statements
This news release contains “forward-looking information” within the meaning of the applicable Canadian securities legislation that is based on expectations, estimates, projections, and interpretations as at the date of this news release. Forward-looking statements including, but are not limited to, statements with respect to the ability to execute the Company’s plans relating to the O’Brien Gold Project as set out in the PEA; the Company’s ability to complete its planned exploration and development programs; the absence of adverse conditions at the O’Brien Gold Project; the absence of unforeseen operational delays; the absence of material delays in obtaining necessary permits; the price of gold remaining at levels that render the O’Brien Gold Project profitable; the Company’s ability to continue raising necessary capital to finance its operations; the ability to realize on the mineral resource and mineral reserve estimates; assumptions regarding present and future business strategies, local and global geopolitical and economic conditions and the environment in which the Company operates and will operate in the future;, planned and ongoing drilling, the significance of drill results, the ability to continue drilling, the impact of drilling on the definition of any resource, and the ability to incorporate new drilling in an updated technical report and resource modelling; the Company’s ability to grow the O’Brien Gold Project; the ability to negotiate and execute an arrangement with IAMGOLD related to the Doyon Mill on satisfactory terms or at all; and the ability to convert inferred mineral resources to indicated mineral resources.
Any statement that involves discussions with respect to predictions, expectations, interpretations, beliefs, plans, projections, objectives, assumptions, future events or performance (often but not always using phrases such as “expects”, or “does not expect”, “is expected”, “interpreted”, “management’s view”, “anticipates” or “does not anticipate”, “plans”, “budget”, “scheduled”, “forecasts”, “estimates”, “believes” or “intends” or variations of such words and phrases or stating that certain actions, events or results “may” or “could”, “would”, “might” or “will” be taken to occur or be achieved) are not statements of historical fact and may be forward-looking information and are intended to identify forward-looking information. Except for statements of historical fact relating to the Company, certain information contained herein constitutes forward-looking statements. Forward-looking information is based on estimates of management of the Company, at the time it was made, involves known and unknown risks, uncertainties and other factors which may cause the actual results, performance or achievements of the companies to be materially different from any future results, performance or achievements expressed or implied by such forward-looking information. Such factors include, among others; the risk that the O’Brien Gold Project will never reach the production stage (including due to a lack of financing); the Company’s capital requirements and access to funding; changes in legislation, regulations and accounting standards to which the Company is subject, including environmental, health and safety standards, and the impact of such legislation, regulations and standards on the Company’s activities; price volatility and availability of commodities; instability in the global financial system; the effects of high inflation, such as higher commodity prices; the risk of any future litigation against the Company; changes in project parameters and/or economic assessments as plans continue to be refined; the risk that actual costs may exceed estimated costs; geological, mining and exploration technical problems; failure of plant, equipment or processes to operate as anticipated; accidents, labour disputes and other risks of the mining industry; delays in obtaining governmental approvals or financing; risks relating to the drill results at O’Brien; the significance of drill results; and the ability of drill results to accurately predict mineralization. Although the forward-looking information contained in this news release is based upon what management believes, or believed at the time, to be reasonable assumptions, the parties cannot assure shareholders and prospective purchasers of securities that actual results will be consistent with such forward-looking information, as there may be other factors that cause results not to be as anticipated, estimated or intended, and neither the Company nor any other person assumes responsibility for the accuracy and completeness of any such forward-looking information. The Company believes that this forward-looking information is based on reasonable assumptions, but no assurance can be given that these expectations will prove to be correct and such forward-looking statements included in this press release should not be unduly relied upon. The Company does not undertake, and assumes no obligation, to update or revise any such forward-looking statements or forward-looking information contained herein to reflect new events or circumstances, except as may be required by law. These statements speak only as of the date of this news release.
Please refer to the “Risks and Uncertainties Related to Exploration” and the “Risks Related to Financing and Development” sections of the Company’s Management’s Discussion and Analysis dated April 29, 2025 for the years ended December 31, 2024, and the Company’s Management’s Discussion and Analysis dated May 28, 2025 for the three-months ended March 31, 2025, all of which are available electronically on SEDAR+ at www.sedarplus.ca. All forward-looking statements contained in this press release are expressly qualified by this cautionary statement.
Neither the TSX Venture Exchange nor its Regulation Services Provider (as that term is defined in the policies of the TSX Venture Exchange) accepts responsibility for the adequacy or accuracy of this news release. No stock exchange, securities commission or other regulatory authority has approved or disapproved the information contained herein.

Technology
How Miami’s Sports Culture Reflects the High-Energy Mindset Driving Today’s Tech Innovations – Five Reasons Sports Network

The Competitive Spirit That Powers Both Sports and Startups
Miami sports fans know that greatness comes from more than talent alone. Whether it’s the Heat grinding through a tight fourth quarter or the Dolphins executing a perfectly timed offensive scheme, winning requires discipline, fast thinking, and an unshakeable competitive spirit. Interestingly, these same qualities power the tech and startup world, where entrepreneurs make split-second decisions that can define the future of an entire business.
In both arenas, success belongs to those who can read momentum, adapt under pressure, and turn small opportunities into game-changing wins. That overlap is why so many sports-minded individuals naturally thrive in the world of business, innovation, and technology.
Why Analytics in Sports Fuel Smarter Business Thinking
Today’s sports landscape is driven by analytics—shot charts, win probability graphs, EPA metrics, and possession efficiency numbers are all part of modern fan knowledge. This analytical mindset doesn’t stop at the arena. Tech entrepreneurs, founders, and investors rely on the same data-driven thinking to navigate product decisions, market shifts, and competition.
This crossover is why the startup world attracts problem solvers shaped by sports culture. And platforms in the entertainment-tech space—such as Foxy gold casino—reflect this growing connection between digital innovation, predictive thinking, and user engagement.
Understanding Momentum: A Shared Advantage for Founders and Athletes
Momentum is everything. In sports, a single run, turnover, or three-pointer can change the energy in seconds. In business, momentum might be a viral post, a successful beta launch, or hitting a major funding milestone. Leaders in both fields understand how to recognize momentum and capitalize on it.
This parallels perfectly:
- Athletes ride hot streaks.
- Founders capitalize on traction.
- Sports teams adjust mid-play.
- Startups pivot product strategy just as quickly.
The ability to shift gears on the fly is one of the most important skills in sports and tech alike.
Building a Winning Strategy: What Startups Can Learn From Miami Sports
1. Scouting and Research Matter
Sports teams invest heavily in scouting reports and film studies. They evaluate:
- Opponent strengths
- Player tendencies
- Lineup matchups
- Efficiency ratings
Startups mirror this with market research, user interviews, competitive analysis, and data modeling. Knowing the landscape allows founders to execute smarter, faster, and with more confidence.
2. Team Culture Determines Long-Term Success
The Miami Heat built the “Heat Culture,” known for discipline, conditioning, and accountability. Startups adopting similar cultural principles see major benefits:
- Clear leadership and communication
- Defined expectations
- Continuous improvement
- Resilience under pressure
A strong culture is often the difference between a startup that scales—and one that collapses.
3. Adaptability Separates Winners From the Rest
Sports demand constant adjustments: defensive rotations, halftime strategies, and clutch-time decisions. Startups face equally rapid shifts:
- Market changes
- New competitors
- Shifting user demand
- Technological breakthroughs
Founders who adapt quickly, without losing their vision, stay competitive.
Table: Business Lessons Inspired by Miami’s Sports Playbook
| Miami Sports Principle | Startup Application | Tech/Innovation Impact |
| Heat Culture | Strong internal systems | Higher productivity & retention |
| Film study & analytics | Market and user research | Better decision-making |
| In-game adjustments | Product pivots | Faster adaptation to trends |
| Team chemistry | Cross-functional collaboration | Smoother product scaling |
| Game-winning mentality | Resilient leadership | Strong long-term growth |
How Miami’s Fast-Paced Environment Fuels Innovation
South Florida’s sports scene is known for energy, excitement, and bold plays. Coincidentally, Miami’s startup scene mirrors that same intensity. The city has quickly become a hub for fintech, AI, gaming, and digital entertainment. Entrepreneurs here are used to speed—speed of execution, iteration, and scaling.
A few reasons Miami is thriving in the innovation sector:
- Diverse global talent
- High investor interest
- Strong tech community backing
- Growing digital entertainment market
- Crossover influence from sports and media
Miami is one of the few cities where sports culture and startup culture genuinely feed each other.
Technology Is Changing the Game—On the Field and in the Office
Technology has reshaped sports with player-tracking systems, real-time analytics, and dynamic stat models. Meanwhile, tech startups use automation, AI-driven insights, and SaaS platforms to accelerate growth. Both industries depend on innovation to stay ahead.
Today’s fans and founders alike have access to tools such as:
- Predictive analytics
- Machine learning insights
- Automated reporting dashboards
- Real-time performance tracking
- Competitive intelligence platforms
This shared tech ecosystem keeps both sports teams and startups laser-focused on performance.
The Role of Mindset: What Makes Sports Fans Natural Innovators
Sports fans understand pressure. They analyze plays, debate strategies, track performance trends, and anticipate outcomes. These instincts make them naturally suited for entrepreneurship and tech leadership.
Key mindset overlaps include:
- Confidence under pressure
- Long-term thinking
- Understanding risk and reward
- Embracing competition
- Continuous improvement
Sports create thinkers who thrive in fast-paced, unpredictable environments—the exact conditions startups face daily.
Why the Connection Between Sports and Startups Keeps Growing
Sports influence is everywhere—from data modeling to team culture to leadership strategy. At the same time, tech continues to elevate sports through analytics, digital enhancements, and real-time engagement tools. The crossover strengthens every year, especially in vibrant markets like Miami.
As both industries push forward, one thing remains true: the mindset that wins games is the same mindset that builds the next big company. Athletes, analysts, fans, and founders all share a core advantage—a competitive drive, sharpened by strategy, that fuels consistent growth.
Lakeview Academy in Gainesville recently unveiled its newly renovated Innovation and Technology Wing.
The learning environment is designed to inspire creativity, collaboration, and hands-on problem-solving.
“The expanded robotics and esports facilities give our students room to imagine bigger and build bolder,” Technology Director Mikhail Lovell, said. “With advanced tools like industrial laser cutters and high-performance 3D printers, they can design and create with a level of precision and freedom that we couldn’t offer before. This renovation strengthens the programs our students already love while opening the door to new opportunities for innovation, growth, and achievement.”
School officials said the renovation was made possible through Lakeview donors and community partners who share in the school’s mission to cultivate curiosity, excellence, and forward-thinking leadership.
“This renovation represents more than just new facilities,” John Simpson, Head of School at Lakeview Academy, said. “It is an investment in our students’ future and a reflection of Lakeview’s vision to provide a learning environment that mirrors the innovation and collaboration found in today’s leading industries.”

The Game Awards 2025 concluded on December 11 in Los Angeles, celebrating a standout year in gaming. The ceremony unveiled the full All Winners List across major categories, including Game of the Year, Best Art Direction, Best Narrative, and more. Fans tuned in worldwide to see whether Clair Obscur Expedition 33, Death Stranding 2 On the Beach, or Donkey Kong Bananza would claim top honors.
This year delivered an unusually competitive field. Nearly every major genre saw multiple critically acclaimed releases. The All Winners List highlights how diverse the gaming landscape has become, rewarding innovation, storytelling, performance, and design. Below is the complete breakdown of winners as confirmed during the live show.
Full All Winners List for The Game Awards 2025
The Game Awards recognized excellence across more than 30 categories. The All Winners List below reflects the official results announced during the broadcast. These selections were made through a combination of jury voting and fan participation. Trusted outlets such as Reuters and AP covered the event throughout the week, citing its global impact on the entertainment industry.
The ceremony featured wins for established franchises, emerging studios, and standout indie titles. Clair Obscur Expedition 33 dominated several major categories, cementing its status as one of the year’s most influential releases. Death Stranding 2 On the Beach and Hollow Knight Silksong also secured notable wins across art, music, and direction.

The winners list includes categories such as:
- Game of the Year
- Player’s Voice
- Best Game Direction
- Best Adaptation
- Best Narrative
- Best Art Direction
- Best Score and Music
- Best Audio Design
- Best Performance
- Innovation in Accessibility
- Games for Impact
- Best Ongoing Game
- Best Community Support
- Best Independent Game
- Best Debut Indie Game
- Best Mobile Game
- Best VR/AR Game
- Best Action Game
- Best Action/Adventure Game
- Best RPG
- Best Fighting Game
- Best Family Game
- Best Sim/Strategy Game
- Best Sports/Racing Game
- Best Multiplayer Game
- Most Anticipated Game
- Content Creator of the Year
- Best Esports Game
- Best Esports Athlete
- Best Esports Team
Each winner reflects the shifting trends of interactive entertainment. Publishers invested heavily in cinematic storytelling, AI-driven mechanics, and world-building. Indie studios saw renewed recognition, demonstrating how smaller teams continue to push creative boundaries.
How the 2025 All Winners List Shapes the Industry
The impact of the All Winners List extends far beyond the ceremony. Industry analysts note that Game Awards recognition often boosts sales, renews franchise momentum, and influences publisher strategies for the following year. Reuters reported that award-winning titles typically experience a significant rise in global downloads after the show’s conclusion.
For indie creators, nominations and wins can accelerate distribution partnerships and platform support. For major studios, standout wins in categories such as Game Direction or Narrative reinforce creative leadership and help guide long-term development pipelines.
The All Winners List also redirects attention toward emerging technologies showcased in nominated titles. VR advancements, accessibility innovations, and audio engineering breakthroughs from this year’s winners are expected to shape next-generation game design approaches.
The Game Awards 2025 All Winners List underscores how far the medium has evolved. It highlights a year defined by risk-taking, creativity, and boundary-pushing design. Fans now look ahead to 2026 as studios aim to build on the momentum created by this remarkable lineup of winners.
FYI (keeping you in the loop)-
Q1: What is included in The Game Awards 2025 All Winners List?
The list includes winners across more than 30 categories, covering major genres and industry achievements. Categories range from Game of the Year to Best Esports Team.
Q2: Which game won the most awards in 2025?
Clair Obscur Expedition 33 earned multiple major category wins, reflecting strong critical and fan support.
Q3: Why is The Game Awards All Winners List important?
The list influences sales trends, industry recognition, and future project investment decisions. It sets expectations for upcoming releases.
Q4: How are winners selected for The Game Awards?
A combined jury and public voting system determines winners. Both professional critics and global players contribute.
Q5: Does winning an award impact game development studios?
Recognition often leads to increased funding, hiring, and platform visibility. It can also validate creative direction for future titles.
iNews covers the latest and most impactful stories across
entertainment,
business,
sports,
politics, and
technology,
from AI breakthroughs to major global developments. Stay updated with the trends shaping our world. For news tips, editorial feedback, or professional inquiries, please email us at
[email protected].
Get the latest news and Breaking News first by following us on
Google News,
Twitter,
Facebook,
Telegram
, and subscribe to our
YouTube channel.


Gaming PC Market is witnessing rapid expansion as gaming evolves into one of the largest and most impactful segments of the digital entertainment industry. According to Market Research Future (MRFR), the Gaming PC Market Size was valued at USD 46.98 billion in 2024. The Gaming PC industry is projected to grow from USD 50.41 billion in 2025 to USD 101.9 billion by 2035, exhibiting a strong and consistent compound annual growth rate (CAGR) of 7.29% during the forecast period from 2025 to 2035.
The rise of high-performance gaming hardware, increasing popularity of competitive gaming, and strong global demand for immersive entertainment experiences are major factors supporting market growth. Gaming PCs are now central to professional eSports, casual gaming, and content creation, making the industry a key driver of technological innovation.
Market Drivers Fueling the Growth of the Gaming PC Market
One of the primary drivers accelerating the Gaming PC Market is the explosive rise of the global eSports ecosystem. Millions of players participate in online competitions, and large-scale tournaments attract global audiences. Professional gamers demand high-performance PCs capable of delivering maximum responsiveness, minimal lag, and high frame rates, directly boosting the need for advanced gaming systems.
Another critical driver is rapid GPU and CPU innovation. Leading hardware manufacturers continue to develop powerful processors and graphics cards equipped with next-generation capabilities such as ray tracing, AI-enhanced rendering, and ultra-fast clock speeds. These innovations significantly elevate gaming experiences and motivate both casual gamers and professionals to upgrade their systems.
The increasing popularity of open-world, high-resolution, and graphically demanding games is further boosting Gaming PC adoption. Modern titles require advanced hardware to support realistic visuals and immersive gameplay, pushing consumers toward high-end gaming PCs.
The rise of game streaming and content creation is also contributing to market expansion. Platforms such as Twitch, YouTube Gaming, and Facebook Gaming are encouraging gamers to produce high-quality content. This requires powerful systems that support streaming, recording, editing, and gameplay simultaneously.
Customization and personalization trends are shaping consumer behavior as well. Gamers increasingly prefer custom-built PCs with RGB lighting, advanced cooling solutions, and modular components. This trend is creating new opportunities for manufacturers, retailers, and PC assembly services globally.
Get An Exclusive Sample of the Research Report at – https://www.marketresearchfuture.com/sample_request/26477
Key Market Trends Shaping the Gaming PC Market
The Gaming PC Market is being reshaped by a number of powerful trends. One of the most significant is the integration of artificial intelligence into gaming hardware. AI-driven optimization tools help maximize performance, regulate cooling, enhance frame rates, and adjust settings in real time.
Another major trend is the growing dominance of high-performance gaming laptops. With advancements in thermal engineering and GPU performance, gaming laptops now offer nearly desktop-level power. This trend supports gamers who value flexibility and portability without sacrificing performance.
High-refresh-rate monitors are becoming standard among gamers. Demand for 144Hz, 240Hz, and even 360Hz displays is rising as gamers seek smoother animation and higher responsiveness, driving the need for PCs capable of supporting these advanced displays.
Liquid cooling systems are also gaining popularity. As gaming hardware becomes more powerful, maintaining safe temperatures is essential. Gamers increasingly adopt closed-loop and custom-loop liquid cooling systems to ensure long-term stability and performance.
Sustainable and energy-efficient gaming solutions are emerging as a new trend. Manufacturers are focusing on recyclable components, environmentally friendly production processes, and energy-efficient power supplies. This aligns with global sustainability awareness and appeals to environmentally conscious gamers.
Buy Now Immediate Delivery Available at – https://www.marketresearchfuture.com/checkout?currency=one_user-USD&report_id=26477
Regional Analysis of the Gaming PC Market
North America currently dominates the Gaming PC Market, supported by a large base of professional gamers, robust digital infrastructure, and widespread adoption of high-performance gaming systems. The United States remains a global leader in gaming hardware development and eSports investment.
Europe holds a significant share of the market as well. Countries such as Germany, France, and the United Kingdom have strong gaming cultures, extensive PC gaming communities, and widespread interest in competitive gaming. Government recognition of eSports as an official sport in certain regions has further strengthened market demand.
The Asia-Pacific region is poised for the highest growth rate during the forecast period. Nations such as China, South Korea, Japan, and India are expanding rapidly in the gaming ecosystem. China leads the region with millions of active gamers and strong investment in gaming arenas, esports stadiums, and internet cafés. South Korea remains a global pioneer in professional gaming and eSports.
Latin America is also witnessing rising Gaming PC adoption. Countries such as Brazil, Mexico, and Argentina are experiencing increasing interest in professional gaming and streaming, supported by improved internet connectivity and the establishment of local gaming events.
In the Middle East and Africa, gaming is expanding as younger populations adopt digital entertainment. Countries such as the UAE and Saudi Arabia are investing heavily in eSports infrastructure, creating new opportunities for Gaming PC manufacturers.
Challenges and Constraints in the Gaming PC Market
Despite strong growth potential, the Gaming PC Market faces several challenges. One major constraint is the high cost of components such as GPUs, CPUs, and high-performance RAM. Price fluctuations and supply shortages often discourage consumers from purchasing or upgrading gaming PCs.
Another challenge is the global supply chain volatility that affects semiconductor manufacturing. Limited chip availability during periods of high demand can delay product releases and reduce availability in key markets.
Energy consumption and heat generation are significant constraints as well. High-performance systems require efficient cooling solutions, and inadequate thermal management can impact performance and hardware longevity.
The rapid pace of technological change can also be a barrier for consumers. Frequent hardware upgrades may be required to support the latest games, making ownership costly for budget-conscious gamers.
Cybersecurity concerns surrounding online gaming and digital downloads pose additional challenges. Gamers are at risk of malware attacks, hacking, and data breaches, making security software an essential component of gaming setups.
Opportunities Driving Future Growth of the Gaming PC Market
Despite challenges, the Gaming PC Market offers vast opportunities. The expansion of VR and AR gaming is creating strong demand for powerful gaming PCs capable of supporting immersive experiences. As VR titles grow more sophisticated, hardware requirements will increase, benefiting the Gaming PC industry.
Cloud-connected gaming PCs present another major opportunity. Hybrid gaming systems that combine traditional hardware with cloud-based rendering can enhance performance and enable cost-effective upgrades.
The rise of gaming-focused social platforms is opening opportunities for PC manufacturers and accessories companies. Integrated ecosystems that support gaming, streaming, editing, and social interaction are becoming increasingly popular.
Emerging markets present strong potential for future expansion. Countries in Southeast Asia, the Middle East, Eastern Europe, and Africa are witnessing fast-growing gaming communities and rising disposable incomes, driving demand for affordable gaming PCs.
The growing support for STEM education and gaming-related careers such as game development, animation, and broadcasting is also fueling market demand. Students and professionals require powerful machines that deliver both gaming and productivity performance.
Explore the In-Depth Report Overview – https://www.marketresearchfuture.com/reports/gaming-pc-market-26477
The Gaming PC Market is set for robust expansion as global demand for high-performance gaming systems continues to rise. With a projected CAGR of 7.29% through 2035, the industry will benefit from technological innovation, eSports growth, immersive gaming trends, and rising participation in global gaming communities. Gaming PCs are becoming more advanced, more customizable, and more accessible, making them essential tools for gamers, streamers, content creators, and digital professionals alike. As hardware manufacturers push boundaries and gaming culture expands worldwide, the Gaming PC Market will remain a powerful driver of digital entertainment and global technological development.
About Market Research Future:
At Market Research Future (MRFR), we enable our customers to unravel the complexity of various industries through our Cooked Research Report (CRR), Half-Cooked Research Reports (HCRR), Raw Research Reports (3R), Continuous-Feed Research (CFR), and Market Research & Consulting Services.
MRFR team have supreme objective to provide the optimum quality market research and intelligence services to our clients. Our market research studies by products, services, technologies, applications, end users, and market players for global, regional, and country level market segments, enable our clients to see more, know more, and do more, which help to answer all their most important questions.
Contact Us:
Market Research Future (Part of Wantstats Research and Media Private Limited)
99 Hudson Street, 5Th Floor
New York, NY 10013
United States of America
+1 628 258 0071 (US)
+44 2035 002 764 (UK)
Email: sales@marketresearchfuture.com
Website: https://www.marketresearchfuture.com
This release was published on openPR.

A mobile-class processor powers the unit and includes 16 GB of RAM and up to 1 TB of internal storage. A dual-fan assembly and heat pipe design provide cooling. Battery capacity supports several hours of sustained gameplay, depending on the title and settings. Wireless connectivity includes Wi-Fi 6 and Bluetooth 5.2.
Image Credit: AYANEO
Technology
SA Gaming confirms presence at ICE Barcelona 2026 with showcase of premium live casino solutions

ICE Barcelona, which gathers more than 600 solution providers and an estimated 55,000 global gaming professionals, continues to serve as a critical hub for business expansion, technological innovation and international networking.
For SA Gaming, the event represents a prime opportunity to demonstrate its advances in live casino technology while strengthening its commercial footprint across Europe and beyond.
“We are excited to join ICE Barcelona 2026 and share our newest developments directly with operators and industry partners,” the company said. “The event provides the perfect setting to present our innovations and build strategic partnerships that can fuel long-term growth.”
Visitors to Stand 1E50 will have the opportunity to experience firsthand SA Gaming’s latest platform updates, table game enhancements and interactive live dealer features designed to increase player engagement and operational efficiency.
Event Details
Dates: January 19–21, 2026
Location: Fira Barcelona Gran Via, Barcelona, Spain
Stand: 1E50
SA Gaming is also inviting operators, partners and prospective clients to schedule dedicated meetings with its team during the three-day event. Those interested can secure an appointment through the company’s booking link.
As the countdown to ICE Barcelona 2026 begins, SA Gaming positions itself among the top exhibitors preparing to shape the future of live casino technology on one of the industry’s most prominent stages.
SA Gaming
SA Gaming is a leading Live Game Solution provider offering premium online entertainment for more than 15 years. Making use of state-of-the-art technology, it offers a full spectrum of Live Games including Baccarat, Roulette, Blackjack and many more.
The company has a Supplier License and an RGS Approval from the Ministry of Foreign Trade and Tourism of Peru (MINCETUR) and a B2B License from the Curacao Gaming Control Board (GCB). Every product is developed by professionals with diligence, and comes with trustworthy support services.
SA Gaming’s products are very popular among players around the world. Winner of the “Best Live Casino Provider” at SiGMA Asia Awards, “Best Live Dealer Solution” at Asia Gaming Awards, “Developer of the Year” at SPiCE Awards, and many other awards, SA Gaming’s efforts and achievements are well recognized in the industry.
Fonte: GMB

$54 million college football coach now favored to be next Michigan head coach

Hometown newspapers few and far between | Opinion and Commentary
Wisconsin volleyball knocks off Stanford in Sweet 16, moves to Elite 8

Nebraska volleyball faces Texas A&M in regional final on Channel 8

Tracking undefeated women’s volleyball teams in 2025

Dale Earnhardt Jr likens underrated NASCAR star to Martin Truex Jr – Motorsport – Sports

Trump calls NIL a ‘disaster’ for college sports and Olympics

Ignite Gymnastics brings home three state champions
Summit Racing Equipment | Error 410: Resource Gone

Lakewood vs. Jordan, Boys’ Basketball – The562.org

Kyle Larson has honest response to bold claims on success – Motorsport – Sports

Bass Pro Shops owner calls out NASCAR commissioner Steve Phelps

Mohammed Ben Sulayem re-elected FIA president – Field Level Media – Professional sports content solutions

Steinbrecher Named ECAC Coach of the Year, Louisell Named First Team

Kirk Herbstreit honors Arch Manning with major college football award

First Tee Winter Registration is open

Fargo girl, 13, dies after collapsing during school basketball game – Grand Forks Herald

CPG Brands Like Allegra Are Betting on F1 for the First Time

Volleyball Recaps – November 18

F1 Las Vegas: Verstappen win, Norris and Piastri DQ tighten 2025 title fight

Two Pro Volleyball Leagues Serve Up Plans for Minnesota Teams

Utah State Announces 2025-26 Indoor Track & Field Schedule

Sycamores unveil 2026 track and field schedule

Redemption Means First Pro Stock World Championship for Dallas Glenn
Jo Shimoda Undergoes Back Surgery

Robert “Bobby” Lewis Hardin, 56

Texas volleyball vs Kentucky game score: Live SEC tournament updates

How this startup (and a KC sports icon) turned young players into card-carrying legends overnight

Bowl Projections: ESPN predicts 12-team College Football Playoff bracket, full bowl slate after Week 14
Wisconsin volleyball sweeps Minnesota with ease in ranked rivalry win

 NBA Legend Michael Jordan to Join NBC Sports as Special Contributor
 Why a rising mid-major power with an NCAA Tournament team opted out of revenue-sharing — and advertised it
 Falcons mailbag
 Portal Update – Basketball and Gymnastics Take Hits
 has always dreamed in Mercurial. Now his initials are on the boots.
The new Kyl…
has always dreamed in Mercurial. Now his initials are on the boots.
The new Kyl…
-
 Rec Sports3 weeks ago
First Tee Winter Registration is open
-
 Rec Sports2 weeks ago
Fargo girl, 13, dies after collapsing during school basketball game – Grand Forks Herald
-
 Motorsports3 weeks ago
CPG Brands Like Allegra Are Betting on F1 for the First Time
-
 Motorsports3 weeks ago
F1 Las Vegas: Verstappen win, Norris and Piastri DQ tighten 2025 title fight
-
 Sports3 weeks ago
Two Pro Volleyball Leagues Serve Up Plans for Minnesota Teams
-
 Sports3 weeks ago
Sycamores unveil 2026 track and field schedule
-
 Sports3 weeks ago
Utah State Announces 2025-26 Indoor Track & Field Schedule
-
 Motorsports2 weeks ago
Jo Shimoda Undergoes Back Surgery
-
 Motorsports2 weeks ago
Redemption Means First Pro Stock World Championship for Dallas Glenn
-
 Sports3 weeks ago
Texas volleyball vs Kentucky game score: Live SEC tournament updates