
Sports
The Novelty of New Stadiums

Authors: Richard Flight1 and Mark Mitchell2
Mark Mitchell, DBA
Professor of Marketing
Associate Dean, Wall College of Business
NCAA Faculty Athletics Representative (FAR)
Coastal Carolina University
P. O. Box 261954
Conway, SC 29528
(843) 349-2392
Richard Flight, PhD is Associate Professor of Marketing at Coastal Carolina University in Conway, SC. He previously worked in minor league baseball with the Memphis Redbirds and Birmingham Barons as well as Division I college athletics at Samford University.
Mark Mitchell, DBA is Professor of Marketing at Coastal Carolina University in Conway, SC. He has served for 10 years as the NCAA Faculty Athletics Representative (FAR). He has conducted much research on minor league sports.
The Novelty of New Stadiums: Evidence from 40 Years in Major League Baseball
ABSTRACT
Purpose: The purpose of this study is to advance a new model to estimate the stadium novelty effect for newly-built Major League Baseball (MLB) stadiums over the last 40 years. Unlike prior studies that use nominal annual attendance data, this study uses marginal attendance change to capture the impact new stadiums have on attendance when mitigating (or controlling for) the impact that team performance has on attendance.
Methods: The incidence of the construction of new MLB stadiums is identified over a 40+ year period. Using a difference-in-differences (DiD) method, a base attendance model is estimated. Then, the new stadium construction observations are added to capture the effect they have on predicted attendance. Unique to this study, marginal change in attendance is used rather than change in (absolute) nominal attendance. Year-over-year percentage change in attendance helps nullify key deficiencies in prior studies such as stadium size disparities and variations in market size. Additionally, this research combines the effects of extensive team performance variables and player salaries to control for non-stadium externalities which also impact attendance.
Results: There have been 23 new MLB stadiums built from 1980-2023. Stadiums for expansion teams or team relocations are not included in this study. Collectively, the MLB teams that built new stadiums see, on average, a 29.6% increase in attendance during the first year in the new stadium with effects lasting up to 21 years. When controlling for other factors (player salaries, winning percentage and other team statistics) the novelty effect is significant (b = .216) in multiple regression analysis.
Conclusion: Teams that build new baseball stadiums can expect an increase in attendance when controlling for team performance and player salaries. This effect holds even while some new stadiums were purposefully built to have fewer fans and offer a ‘closer-to-game’ fan experience. In other cases, the addition of luxury boxes reduced the number of available seats but added a class of seats that demand a premium price from consumers. This strategy allowed teams to cultivate new fans and new revenue streams for their teams.
Application in Sport: A baseball stadium is a fixed asset with an anticipated lifespan. No stadium lasts forever in its original form. At some point, a stadium must be remodeled or replaced to meet the needs of current consumers or fans may shy away from attending games. New stadiums can help grow attendance, diversify the fan base, and develop new revenue streams to help teams compete financially in Major League Baseball.
Key Words: stadium novelty effect; Major League Baseball; attendance; new stadium construction; franchise expansion
The Novelty of New Stadiums: Evidence from 40 Years in Major League Baseball
INTRODUCTION
Ballpark managers, team owners, and city officials often cite lagging attendance as the prime reason to build new sport facilities and stadiums. They argue an out-of-date stadium discourages fan attendance and recommend the investment in new-and-improved stadiums. A key goal associated with building a new facility is revenue growth by increasing fan attendance with the promise of an enhanced fan experience, often with an expanded premium ticket and entertainment options. These new facilities often offer operating efficiencies with the use of new technology to lower operating costs and boost profit margins for stadium operators (28).
Historically, when a team builds a new stadium their observed attendance goes up (35). Anecdotally, a new facility brings greater enthusiasm from not only the fan base but also from media partners, advertisers, and players that see grandeur in the new stadium. For example, the Atlanta Braves moved from Turner Field (located in downtown Atlanta) to then-named SunTrust Park (located in the northern suburbs) in 2017. Total attendance for the first season at Sun Trust Park increased approximately 24% over the final season at Turner Field. The new stadium offered a comprehensive gameday experience including dining and shopping that went beyond a traditional baseball game. Further, the suburban location was more accessible to many fans, including expanded parking facilities (32). Though fan attendance can sometimes decline after the opening year (38), the average attendance per game in Atlanta’s SunTrust Park actually increased in year two and year three (3).
The purpose of this study is to advance a new method to estimate the Stadium Novelty Effect in Major League Baseball by examining newly-built MLB stadiums and the associated attendance figures over a 40+ year period. First, a brief description of relevant literature is provided. Next, the study methods are presented as well as the data analysis plan. Finally, the findings are presented and the implications for baseball team owners and communities are advanced.
THE IMPACT OF NEW STADIUMS IN SPORT
Fan Attendance and the Fan Experience
The phenomenon of attributing increased fan attendance to the introduction of a new stadium is known as the Stadium Novelty Effect (2, 7, 8, 14, 18, 27). This effect, also referred to as the Honeymoon Effect (4), has been observed in numerous applications including: European soccer (10, 35); baseball (6); basketball (5); and hockey (18).
There is broad agreement that attendance tends to increase with the introduction of a new stadium. There is less agreement on the duration of this positive impact on attendance. In early literature by Noll (26), the stadium novelty effect was estimated to last somewhere between seven and eleven years. More recently, Hamilton and Kahn (16) estimate a much shorter three-year duration of this temporary surge in attendance. Others suggest the temporary upward shift is followed by a return to the original attendance levels with limited long-term benefits (14, 36). Howard and Crompton (18) conclude that the initial stadium novelty effect is limited often to just a single year with eventual declines after the first year in the new facility after studying NFL, MLB, NBA and NHL leagues. Most recently, Bradbury (5) suggested a new stadium will bring an initial surge in attendance that breaks down over the initial ten-year period.
One motivation for new stadium construction and renovation is the fan’s experience based upon the facility and its service environment. It must be noted, however, that sport fans can vary in their degree of fandom and their subsequent expectations during game attendance. Both Hoehn and Szymanski (17) and Porat (30) detail a spectrum from casual to involved or committed. Meanwhile, Samra and Wos (33) provide a fan typology including temporary, devoted, and fanatical.
A seminal question to ask is ‘how do fans derive value from the ballpark experience?’ To varying degrees fans value the quality of on-the-field performance. They also value the experience of a game delivered in a safe, clean, and exciting environment provided by a new stadium. Frequently the call for greater amenities is made in the argument for building a new stadium. In fact, it is asserted that new stadiums may become attractions within themselves regardless of team performance (1, 18). The new stadium setting incorporates features that modern, state-of-the-art facilities are expected to have. The ‘stadium as an attraction’ position suggests that fans immerse themselves in the new stadium atmosphere regardless of team performance. In essence, the team’s performance may not be great, but the atmospherics of the stadium creates a pleasurable experience worth the cost and worthy of repeatedly returning for another game. In short, some fans place greater value on the on-field product, whereas others place it on the atmosphere and conditions of the stadium.
While fan experience is vital, the fan base’s devotion to the team and team brand will certainly influence their willingness to attend games. Some teams are known to have loyal fans and seemingly have little trouble reaching stadium capacity. The Chicago Tribune ranked all 30 major league baseball teams by team value (34). Not surprisingly, there is a significant correlation (r = .66) between this team valuation and average team attendance since 1980 (3). These estimated team valuations are provided in Table 1.
Table 1: MLB Teams Ranked by Team Valuation (with Corresponding Fan Attendance)
| Rank | Team | 2024 Valuation ($B) | Average Home Attend (1980-2023) |
| 1 | New York Yankees | 5.59 | 2,986,328 |
| 2 | Arizona Diamondbacks | 4.28 | 2,353,169 |
| 3 | Los Angeles Dodgers | 3.75 | 3,333,426 |
| 4 | Chicago Cubs | 3.67 | 2,619,327 |
| 5 | Boston Red Sox | 3.6 | 2,583,650 |
| 6 | San Francisco Giants | 3.21 | 2,501,129 |
| 7 | New York Mets | 2.48 | 2,486,904 |
| 8 | St. Louis Cardinals | 2.235 | 2,998,742 |
| 9 | Philadelphia Phillies | 2.22 | 2,339,642 |
| 10 | Houston Astros | 2.19 | 2,167,333 |
| 11 | Atlanta Braves | 2.165 | 2,297,852 |
| 12 | Los Angeles Angels | 2.04 | 2,737,988 |
| 13 | Washington Nationals | 2.0 | 1,760,801 |
| 14 | Texas Rangers | 1.84 | 2,285,151 |
| 15 | San Diego Padres | 1.65 | 2,084,153 |
| 16 | Seattle Mariners | 1.62 | 2,009,274 |
| 17 | Chicago White Sox | 1.54 | 1,845,744 |
| 18 | Toronto Blue Jays | 1.53 | 2,460,458 |
| 19 | Minnesota Twins | 1.52 | 1,982,394 |
| 20 | Baltimore Orioles | 1.46 | 2,425,704 |
| 21 | Cleveland Indians | 1.375 | 1,843,168 |
| 22 | Colorado Rockies | 1.36 | 2,769,199 |
| 23 | Detroit Tigers | 1.33 | 2,144,746 |
| 24 | Cincinnati Reds | 1.325 | 2,016,894 |
| 25 | Oakland Athletics | 1.3 | 1,769,573 |
| 26 | Milwaukee Brewers | 1.29 | 2,132,008 |
| 27 | Pittsburgh Pirates | 1.26 | 1,679,759 |
| 28 | Miami Marlins | 1.14 | 1,464,552 |
| 29 | Kansas City Royals | 1.1 | 1,845,441 |
| 30 | Tampa Bay Rays | 1.03 | 1,400,312 |
New Stadiums in MLB
While an expensive and disrupting proposition, building a new stadium is somewhat common in Major Lague Baseball. From 1980-2023, 23 new stadiums were built for non-expansion or relocation teams. Additionally, 5 other new stadiums were built for new franchises (including the Montreal Expos move to Washington, DC). The timing of new stadium constructions between 1980 – 2023 is presented in Figure 1. An overview of the stadiums themselves is provided in the Appendix.
Figure 1: Newly-Built Major League Baseball Stadiums by Year (1980-2023)

Over a thirty-year span the positive impacts of the new stadium effect have been measured by researchers using a variety of methods. Calculating the aggregate impact of new stadiums in Major League Baseball, Fort (11) provides a methodology typical of this research that specifies the difference between the first year in the new stadium and the previous five-year’s averages for those teams that built new stadiums. Fort (11) finds the change in attendance for a select period to be a positive net increase of 624,000 fans for teams that built new stadiums. Conversely, those teams that did not build new stadiums realized a net increase of 96,000 fans over the same time period.
While this common approach speaks to the impact new stadiums have on league attendance, debate continues as to the team and market specific nature of the stadium novelty effect and how to best measure them. Recently, van Ours (35) employed a ‘difference-in-differences’ (DiD) method with a sample of 8 Dutch stadiums. Here, the researchers used a control group to establish an initial model, then introduced new stadium data and observed the change or difference between the two in a two-way fixed effect regression.
This study also uses the ‘difference in differences’ (DiD) method. Unlike prior studies that use attendance per team while also employing time-dependent independent variables, this study uses percentage change in attendance from the immediate prior year for each team including those with new stadiums. Using marginal (or percentage) change in attendance from the prior year marks a deviation from prior studies that use nominal annual attendance as the dependent variable with additional prior years attendances as independent variables. Using prior attendance as independent variables, as in time series modeling, generates significant multi-collinearity concerns and effectively overfits most lagged time series or autoregressive moving average (ARIMA) models. Using nominal change in attendance from one year prior does not carryover anticipated attendance which tends to overfit the model. Further, the use of marginal annual change mitigates the effects of wide variations in both stadium and market sizes across the vast time horizon studied here.
METHODS
This study uses Major League Baseball attendance records, team on-field performance, and new stadium construction data from the 1980 through 2023 playing seasons. In all, 30 teams are represented in the total data set with 23 new stadiums built during that 40+ year time span. The initial subject pool includes Major League Baseball (MLB) team attendance and performance data from 1979 through 2023 which were accessed and downloaded from the data aggregator baseball-reference.com (a depository for sports performance data). The data analysis plan for this study consisted of three stages.
Stage One
The purpose of Stage One is to collect team performance and fan attendance data. Refinements will be made to the data where warranted. For example, team relocations or the awarding of expansion teams do not offer a before-and-after scenario to analyze the stadium novelty effect. So, the data for these years will be excluded. In addition, data attached to seasons that experienced work stoppages are also excluded as it is assumed attendance figures tied to these reasons are atypical for a variety of reasons (such as fan resentment, etc.). Finally, fan attendance data during the COVID-19 period were eliminated as fan attendance limits, public health concerns, and lingering fan apprehension to attend group events impacted game attendance.
Stage Two
The purpose of Stage Two is to develop a base model to predict fan attendance in the absence of a new stadium using the difference-in-difference methodology. Then, team performance and team salary data for each year and team is regressed on the percentage change in team attendance from year to year (the dependent variable). This model can be used to predict attendance and will be later extended to include the effects of new stadiums in Stage Three.
Stage Three
The purpose of Stage Three is to add new stadium attendance observations to the base model along with the addition of a dummy variable to identify these figures as attached to the introduction of a new stadium. It is here that the final results are calculated and the summary findings advanced.
PRESENTATION OF DATA ANALYSIS
Stage One – Refining the Sample Size
Team performance and attendance data were downloaded by team and year from 1980-2023 (inclusive). 26 teams played from 1980-1992, with expansion to 28 teams in 1993, and then again to 30 teams in 1998. Counting each team during this time span, there are 1,288 observations in the initial data set. As previously noted, this study uses a ‘difference-in-differences’ or DiD approach. Bradbury (5) states “a primary concern with DiD comparisons is the selection of control units that are devoid of treatment effects; therefore, it is imperative to exclude observations of teams that may be experiencing novelty influences from existing venues or entering new markets through team relocations and league expansions.” For this reason, new stadium observations were omitted for expansion franchises, including Colorado (1993), Florida (1993), Tampa Bay (1998), and Arizona (1998). Additionally, the relocation of the Montreal Expos to Washington, DC in 2005 was also omitted given the new stadium in a new market had no comparable previous season attendance data.
Impact of Labor Disputes. During the timeline of the study, there were two significant work stoppages (1981 and 1994) due to labor-management disputes. These years pose two challenges observed in the data.
During each strike year, the dependent variable (percent change in attendance) was (on average) noticeably lower than expected.
During the year following the 1981 strike (1982), the dependent variable was (on average) noticeably greater than expected.
These two anomalies lead to an uncontrollable externality that isn’t explained by performance, marketing, or stadium effects and warrant exclusion. As such, the seasons of 1981, 1982, and 1994 are excluded from this analysis.
Impact of COVID-19 Global Pandemic. The 2020 MLB regular season was reduced to 60 games and played without fans. The post-season was played at neutral sites (Globe Life Field Arlington, TX; Minute Maid Park in Houston, TX; Petco Park in San Diego, CA; and Dodger Stadium in Los Angeles, CA). Given the lack of fans (and attendance data), the 2020 season was excluded from this analysis.
Impact of Pent-Up Demand Following Global Pandemic. The lingering effects of COVID seem to decline during the 2022 season as evidenced by the spike in game attendance. This behavioral change by fans caused the dependent variable (percent change in attendance) to be greater than expected for the 2022 season. As illustrated in Figure 2, the reader will note the high and low spikes in average percent change in attendance. These ‘dips’ and ‘spikes’ represent externalities outside the scope of this study. As such, the 2022 season was also excluded from this analysis.
Figure 2: Average Percent Change in MLB Attendance by Year (1980-2023)

Tracking the Revisions to the Sample. Collectively, five MLB seasons (1981, 1982, 1994, 2020, and 2022 we excluded from this analysis for the reasons noted above. Additional data adjustments included accounting for individual abnormal ‘outlier’ observations. Individual observation outliers are identified using Mahalonabis Distance2 analysis (15). In doing so, 117 observations are found to be structurally outside of the norm and were also excluded from this analysis. The final data set consists of 1,001 observations for study analysis. A summary of refinement process that affected the sample size is provided in Table 2.
Table 2: Summary of the Refined Sample Size Used in This Analysis
| Existing Stadiums | New Stadiums | TOTAL | |
| All Years | 1,206 | 23 | 1,228 |
| Excluding franchise expansion, relocations, strike and COVID effected years. | 1095 | 23 | 1118 |
| Final sample excluding outliers. | 978 | 23 | 1,001 |
Stage Two – Creating the Base Model to Predict Attendance (Without New Stadium Data)
Following a difference-in-differences (DiD) methodology (see 5, 35), this stage creates a base model to predict attendance in the absence of any new stadiums. This base model specifies the predictive ability of team variables (such an on-field player performance and player salaries) on attendance. Team performance and salary data from each eligible team and year (i.e., where no new stadium or major stadium renovations occurred) is regressed on the percentage change in attendance (dependent variable). This base model will first be used to predict attendance while later this base model will be extended to include the effect of new stadiums.
While year-over-year marginal change in attendance is the dependent variable, the independent variables include team statistics for offense, defense, and pitching as well as total player payroll (see Table 3 for list of variables). Prior literature has incorporated a limited selection of performance variables and team salary and lagged prior year attendance to predict attendance. Our approach is to incorporate 28 performance variables simultaneously:
Team (4 variables)
Offense (13 variables)
Pitching (6 variables)
Defense (5 variables)
By doing so, the model is able to construct a broader test of variables which may affect attendance. As an economic growth component, payroll suggests that greater player payrolls translate into better on-field performance which impacts attendance (21). It should be noted that the model specification does not incorporate time dependent variables as one might find in a time series analysis. Thus, there is not a controlling element for economic inflation or timely building trends that may emerge over a 40-year time horizon. While league expansion has taken place, study does not use new stadiums as there is no pre- and post-construction paired data.
Table 3: Independent Variables Used in Base Model
| Variable Categories | Variable | Description | |
| Team: | Salary | Estimated player payroll. (Standardized) | |
| Win Percentage | Total wins divided by games played. | ||
| Home Win Percentage | Total wins divided by games played at home only. | ||
| Run Difference | Average difference in runs scored vs runs allowed. | ||
| Offense: | Runs Scored per game | Average runs scored per game. | |
| Hits | Number of hits in the year. | ||
| Doubles | Number of doubles in the year. | ||
| Triples | Number of triples in the year | ||
| Home Runs | Number of home runs in the year. | ||
| Runs Batted In | Number of Runs-Batted-In in the year. | ||
| Stolen Bases | Number of bases stolen in the year. | ||
| Caught Stealing | Times caught stealing in the year. | ||
| Batter Walks | Number of walks in the year. | ||
| Batter Strike Outs | Total batter strike outs in the year. | ||
| Team Batting Average | Number of hits divided by at bats for the team. | ||
| On-Base Percentage | Times reached base divided by plate appearances. | ||
| Slugging Percentage | Percentage of hits weighted by based reached. | ||
| Pitching: | Runs Allowed Per game | Average runs allowed per game. | |
| Team ERA | Average runs given up divided by 9. | ||
| Hits Allowed | Hits allowed by pitchers in a year. | ||
| Home Runs Allowed | Home runs allowed in a year. | ||
| Walks Allowed | Walks allowed in the year. | ||
| Strike Outs Pitched | Strike outs pitched in the year. | ||
| Defense: | Defensive Efficiency | Estimate of balls in play that result in converted outs. | |
| Assists | Assists made in the year. | ||
| Errors Committed | Errors committed in the year. | ||
| Double Plays Turned | Double Plays made in the year. | ||
| Fielding Percentage | (Putouts + Assists) / (Putouts + Assists + Errors) |
Using IBM’s SPSS (version 29.0.1.0) a liner regression is performed using a stepwise entry method for variable selection. This method allows the most attractive variables to be entered into the model first, while consecutively testing, dropping, and adding variables until the best-fitting model emerges.
Stage Three – Creating the Extended Model to Include New Stadium Data
Once a base model is estimated, new stadium attendance observations are added to the sample along with a dummy variable coded for new stadium observations. As noted earlier, 23 new stadiums (observations) are added during this stage which are reflected in this new variable. The new variable that is built into the model during this stage accounts for the presence of a new stadium, coded by ‘1’ while all other observations (existing stadiums) are coded ‘0’. If the stadium novelty effect exists, then the regression coefficient (beta) for the new dummy variable will be significant and the model fit (r2) will improve. Similar to Stage Two, the dependent variables were retained by using a stepwise entry method for variable selection. This stage provides a comparative model directed by the difference-in-difference approach.
RESULTS
Predictive Models
Base Model Without New Stadium Data. A primary goal of this study is to measure the stadium novelty effect while controlling for the influence of team performance and player salaries. During Stage Two, a base model is estimated using a stepwise regression which retained the best predictive variables and strongest model fit. The sample under investigation for base-mode specification has 978 observations resulting in an adjusted r2 fit of .198 and significant F statistic. (see Table 4).
Table 4: Base Model Fit Statistics and Coefficient Estimates
| R | R Square | Adjusted R Square | Std. Error of the Estimate | ||
| 0.450 | 0.202 | 0.198 | 0.155 | ||
| Sum of Squares | Df | Mean Square | F | Sig. | |
| Regression | 5.579 | 5 | 1.116 | 46.429 | <.001 |
| Residual | 22.012 | 916 | .024 | ||
| Total | 27.591 | 921 |
| Unstandardized Coefficients (Beta) | Std. Error | Standardized Coefficients (Beta) | t | Sig. | VIF | |
| (Constant) | -.977 | .113 | -8.627 | <.001 | ||
| Winning Percentage | .957 | .084 | .372 | 11.345 | <.001 | 1.35 |
| Salary | -.043 | .007 | -.251 | -5.862 | <.001 | 2.112 |
| Strikeouts / Game | .025 | .007 | .159 | 3.648 | <.001 | 2.189 |
| Hits | .000 | .000 | .102 | 3.146 | .002 | 1.197 |
| Stolen Bases | .000 | .000 | .083 | 2.645 | .008 | 1.120 |
Extended Model Including New Stadium Data. Upon the addition of new stadium observations during Stage Three, the extended model demonstrates an increase in model fit (r2) from .198 to .230. Moreover, the new stadium dummy variable is significant (.001) and strong when compared to the other variable’s standardized betas, at .216, only “winning percentage” and “batting average” serve as better predictors of changes in attendance from year to year. (see Table 5).
Table 5: Extended Model (with New Stadium Variable) Fit Statistics and Coefficient Estimates
| R | R Square | Adjusted R Square | Std. Error of the Estimate | |||
| .486 | 0.236 | 0.230 | 0.157 | |||
| Sum of Squares | Df | Mean Square | F | Sig. | ||
| Regression | 7.085 | 7 | 1.012 | 41.199 | <.001 | |
| Residual | 22.921 | 933 | .025 | |||
| Total | 30.006 | 940 | ||||
| Unstandardized Coefficients (Beta) | Std. Error | Standardized Coefficients (Beta) | t | Sig. | VIF | |
| (Constant) | -.730 | .072 | -10.201 | <.001 | ||
| Winning Percentage | .950 | .093 | .359 | 10.240 | <.001 | 1.502 |
| New Stadium | .274 | .037 | .216 | 7.480 | <.001 | 1.016 |
| Salary | -.050 | .007 | -.277 | -6.627 | <.001 | 2.138 |
| Strike Outs / Game | .023 | .007 | .139 | 3.362 | <.001 | 2.075 |
| RBIs | .000 | .000 | .151 | 3.937 | <.001 | 1.789 |
| Walks (Hitter) | .000 | .000 | -.109 | -3.019 | .003 | 1.600 |
| Stolen Bases | .000 | .000 | .073 | 2.396 | .017 | 1.124 |
The Magnitude of Stadium Novelty Effects
In this study we define the year prior to a new stadium as a “base-year” and then compare attendance in the new stadium to the base-year. This comparative process found an average change in attendance of 29.6% during the first year of play in a newly-constructed stadium. This 29.6% increase in attendance equates to an average increase of 762,263 fans for a new stadium’s inaugural season. Meanwhile, average marginal change for each successive year remains positive until year 21 as illustrated in Figure 3. By comparison, the average annual change in attendance increases for non-new stadium observations was just 2.36%, or an average increase of 63,553 fans for the study timeframe.
Figure 3: Average Percentage Change in Fan Attendance by Stadium Age

As other studies indicate, attendance attributed to a new stadium is greatest during the first year and diminishes over time. In fact, based on study data new MLB attendance appears to decay at a rate of 1.19% per year after the introduction of the new stadium given the correlation of stadium age (in years) and percent change in attendance (r = .84). While it is unclear if all the factors contribute to attendance decay, it is plausible that the newness or novelty of the stadium diminishes while its new amenities become outdated and/or worn out. This study appears to provide a longer and slower decline in attendance extending Noll (26) that finds the stadium novelty effect is between seven and eleven years and dismisses the one-to-three-year effects that Hamilton and Kahn (16), Voight (36), Greenberg and Gray (14), and Howard and Crompton (18) all find.
A novelty of these findings is the approach used by defining the dependent variable as percent change in attendance in an effort to remove externalities that cannot be controlled across franchises. Annual attendance models using nominal annual attendance fail to capture the effect of stadium size variations and the size of the attendance variable which overweighs time-series data and can capture a very large portion of systemic error from year to year.
The Impact of On-Field Team Performance
This study further advances the current literature on stadium novelty effects by testing numerous team performance variables. Prior studies included a limited number of team performance variables such as “winning percentage” or “playoff appearances” (22). This study’s initial variable pool of 28 performance-related variables offers a more exhaustive list of performance metrics to (assumedly) better capture the influence of team performance on attendance in the presence of stadium novelty effects. In doing so, we find that five variables play a significant role in determining attendance, including: (a) winning percentage (b=.354, <.001); (b) strikeouts per game (b=.139, <.001); (c) RBIs (b=.151, <.001); (d) walks by hitter (b=-.109, .003); and (e) stolen bases (b=.073, .017). Meanwhile, team player salary (b=-.277, <.001), while a significant variable, appears to be negatively associated with attendance change. This finding is unusual and unexpected based on common perceptions that higher paid athletes tend to attract more attention.
As noted, a team’s winning percentage is found to be a key performance driver to attendance. As one can imagine, teams that perform better attract more fans. Data suggests that there is a significant correlation (r = .477) between winning percentage and home attendance figures (3). Likewise, “team ERA” is negatively associated with attendance (r = -.208) and “team batting average” is positively correlated with attendance (r = .221). In short, fans generally show up in greater numbers when teams improve on-field performance. On average, teams realize a modest 1.2% increase in home winning percentage a year after the new stadium is built, which is consistently found in other research (see 19, 20, 29, 31, 37).
CONCLUSIONS
This research builds further support for the impact new stadiums have on short-term fan attendance and financial outcomes. The building of a new stadium can be expected to increase season attendance by 29.3% for the first year of play. That elevated first-year attendance does not last forever. Rather, it tends to decline by approximately 1% per year for the next 20 years. During this entire 20-year span, overall fan attendance tends to remains higher than would have been predicted had the new stadium not been built in the first place.
By (a) modifying the dependent variable to a percent change in attendance and (b) including many more performance indicators as dependent variables, this study adds to the richness of the ongoing research into stadium novelty effects. Limitations of the study include the lack of multi-sport applications as this study focuses on Major League Baseball and does not include other professional sports such as soccer, football, or basketball. In addition, it does not include developmental and/or non-professional leagues.
Moreover, we do not account for cultural trends that may occur promoting or detracting from new stadium construction. Notably, over the time horizon, stadiums have moved from large capacity multi-use facilities to smaller ‘baseball-only’ spaces. Also, there is an increasing trend to re-locate stadiums outside of dense urban areas, Finally, the trend of sprawling multi-business complex models has also added to the art of new stadium construction. Today, new stadiums are built with an economic ecosystem surrounding the facility to include dining, entertainment, and other hospitality venues such as hotels. Finally, the model outlined in this research, while demonstrating sufficient fit statistics, fails to capture all the variation in marginal attendance change on a year-over-year basis. As such, future research should seek to include additional independent variables that can improve the model.
Stadium novelty effects are real and substantial. This study presents a new method to be used to measure and predict their impact on total attendance in any sport and at any level (college, professional, etc.).
APPLICATION IN SPORT
A baseball stadium is a fixed asset with an anticipated lifespan. No stadium lasts forever in its original form. At some point, a stadium must be remodeled or replaced to meet the needs of current consumers or fans may shy away from attending games. New stadiums can help grow attendance, diversify the fan base, and develop new revenue streams to help teams compete financially in Major League Baseball. While, new stadiums represent new branding opportunities, they also offer teams the opportunity to reach new audiences with improved and updated amenities. These benefits likely translate to greater financial outcomes for the team, however the financial debate is complicated affecting many stakeholders. While team owners may be obvious benefactors, the financial incentives offered by local governing bodies reflect a mutual perceived benefit from the broader tax-paying community.
As noted above, the introduction of a new stadium tends to trigger a large increase in first year attendance (over 29%) and while that figure tends to decline over time, the net result is that total attendance tends to stay higher than it would have been in the absence of new stadium construction for the next 20 years. This suggests local governments should be willing to consider some level of public financing for stadium construction for a minimum of 20 years, and possibly longer.
For teams that played in the 1980 MLB season, 6 teams continue to play in their original (albeit updated) stadiums: Boston Red Sox; Chicago Cubs; Kansas City Royals; Los Angeles Angels; Los Angeles Dodgers; and Oakland Athletics. Sixteen MLB teams have occupied 2 stadiums over this period while 3 teams have played in 3 different home stadiums over this 40+ year period. One team (the Montreal Expos) relocated to Washington, DC.
At the time of this writing, 3 new MLB ballparks have been projected including the Oakland A’s new park in Las Vegas with an estimated price tag of $1.75 billion as well as new parks in Tampa Bay and Kansas City. Meanwhile, the Chicago White Sox are exploring new park opportunities (9, 12). Beyond Major League Baseball, new stadium construction is viewed as an integral part of any team brand and fan-base strategy. At least five new Minor League Baseball parks have been built since 2020 including: Beloit Sky Carp’s ABC Supply Stadium; Kannapolis Cannon Ballers’ Atrium Health Ballpark; Worcester Red Sox’ Polar Park; Rocket City Trash Pandas’ Toyota Field; and the Wichita Wind Surge’s Riverfront Stadium (23, 25). It will be interesting to see the impact of these new stadiums on fan attendance in their respective cities.
The issue of new stadium construction and/or the massive remodel of existing baseball stadiums is also taking place in NCAA Division I baseball. The Board of Regents of Georgia State University (located in downtown Atlanta) have approved the construction of a new downtown baseball stadium in the footprint of the old Atlanta-Fulton County Stadium. The new stadium will allow the team to play closer to campus than their current stadium which is located 12 miles from their center-city location (13). Old Dominion University will play its entire 2025 baseball season in away games and/or nearby minor league stadiums (as available) as it remodels its on-campus baseball stadium (24).
Over the last decade, many schools in the Southeastern Conference (such as the University of Florida, University of Kentucky, Mississippi State University, and the University of South Carolina) have greatly expanded, or even replaced, their college baseball stadiums. This wave of stadium updates is expected to continue and spread to other sports and facilities. These new stadiums may possibly extend the research on stadium novelty effects into college sports.
Sports fans have many options for their time, attention, and entertainment dollar. Teams cannot assume casual fans will continue to attend games just because it is part of the local culture. Increasingly demanding fans want an updated fan experience, even in historical stadiums like Wrigley Field in Chicago or Fenway Park in Boston. This study demonstrates that overall attendance goes up when new MLB stadiums are built. While this spiked year-one attendance may decline modestly each year, this ‘decline’ is from an elevated number of fans due to the introduction of new stadium in prior years. So, in an interesting way, the ‘bonus attendance’ of the new stadium provides the cushion (or pays for) the modest reductions in attendance over time. Then, at some point in the future, the team may begin discussions of replacing their now 30-year-old stadium (again).
CONCLUDING REMARKS
When baseball fans wax poetically about their memories of MLB games from their childhoods, these descriptions are not limited to their favorite players. Embedded in these memories are the sights-and-sounds of the stadium, such as the glow of the lights for a night game, the call of the popcorn vendors, or the smell of a hot dog cooking on the grill. Enhancing the in-stadium fan experience is an integral part of success in the sports industry of today.
As noted earlier, 3 MLB teams have played in 3 different home stadiums over the timeframe of this study:
Atlanta Braves: Atlanta-Fulton County Stadium to Turner Field to the current Truist Park.
Minnesota Twins: Metropolitan Stadium to the Hubert Humphry Metrodome to the current Target Field.
Texas Rangers: Arlington Stadium to The Ballpark at Arlington to the current Globe Life Field.
It will be interesting to see the lifespan of these newer stadiums. When Atlanta-Fulton County Stadium, Metropolitan Stadium and Arlington Stadium were all originally constructed, no one could dream of the day when these shining new stadiums would be replaced. Living decades in the future, we know ‘the rest of the story.’ These stadiums have been replaced … and their replacement stadiums have been replaced. The long-term cycle continues.
REFERENCES
- Austrian, Z. and Rosentraub, M. (1997). Cleveland’s gateway to the future. In R.G. Noll and A. Zimbalist (Eds), Sports, Jobs and Taxes. Washington D.C.: The Brookings Institute.
- Baade, R. and Sanderson, A. (1997). The employment effect of teams and sports facilities. In R.G. Noll and A. Zimbalist (Eds.), Sports, Jobs and Taxes, Washington, D.C.: The Brookings Institute.
- Baseball Reference (2024). Atlanta Braves attendance, stadiums, and park factors. Retrieved from: https://www.baseball-reference.com/tools/share.fcgi?id=T5QB2
- Borland, J. and Macdonald, R. (2003). Demand for sport. Oxford Review of Economic Policy, 19(4), 478-502.
- Bradbury, J. (2024). Revisiting the novelty effect from new stadiums: An event study approach. Economic Inquiry, (62), 1722-1747.
- Clapp, C. and Hakes, J. (2005). How long a honeymoon? The effects of new stadiums in Major League Baseball. Journal of Sports Economics, 6(3), 509-521.
- Coates D. and Humphreys, B. (2000). The stadium gambit and local economic development. Regulation, 23(2), 15-20.
- Danielson, M. (1996). Home Team: Professional Sports and the American Metropolis. Princeton University Press.
- ESPN (2024, December 5). A’s clear last major hurdles for $1.75 billion Las Vegas stadium. Retrieved from: https://www.espn.com/mlb/story/_/id/42802400/a-clear-last-major-hurdles-175-billion-las-vegas-stadium
- Feddersen, A., Maennig, W., and Borcherding, M. (2006). The novelty effect of new soccer stadia: The case of Germany. Journal of Sport Finance 1(3). 174-188.
- Fort, R. (2003). Sports Economics. Pearson Education, Inc.
- Future ballparks. (n.d.). Ballparks of Baseball. Retrieved from: https://www.ballparksofbaseball.com/future-ballparks/
- Georgia State University (2024, May 14). Board of Regents approves new downtown baseball stadium. Georgia State University Athletics. Retrieved from: https://georgiastatesports.com/news/2024/5/14/athletics-board-of-regents-approves-new-downtown-baseball-stadium.aspx
- Greenberg, M. and Gray, J. (1996). The Stadium Game. Marquette University Law School; National Sports Law Institute.
- Hair, J., Black, W., Babin, B., and Anderson, R. (2018). Multivariate Data Analysis (8th Edition). Prentice-Hall
- Hamilton, B. and Kahn, P. (1997). Baltimore’s Camden Yards ballparks. In R.G. Noll and A. Zimbalist (Eds.), Sports, Jobs and Taxes, Washington, D.C.: The Brookings Institute.
- Hoehn, T. and Szymanski, S. (1999). The americanization of european football. Economic Policy, 14(28). 205-240.
- Howard, D. and Crompton, J. (2003). An empirical review of the stadium novelty effect. Sport Marketing Quarterly, 12(2), 111-116.
- Huang, Y. and Soebbing, B. (2022). The novelty effect and on-field team performance in new sports facilities: the case of the Canadian Football League. Sport Management Review, 25(1), 88-205.
- Kahane, L. (2005). Production efficiency and discriminatory hiring practices in the National Hockey League: A stochastic frontier approach. Review of Industrial Organization, (27), 47-71.
- Langhorst, B. (2014). What do your fans want? Attendance correlations with performance, ticket prices, and payroll factors. Baseball Research Journal, 43(1),101-108
- Leeds, M., Allmen, P., and Matheson, V. (2018). The Economics of Sports (6th Edition). Routledge.
- MiLB.com (2023). Batting around: New ballparks for a new era. Retrieved from: https://www.milb.com/news/batting-around-new-ballparks-for-a-new-era
- Minium, H. (2024, May 9). ODU’s baseball series against App State is the last at Bud Metheny Stadium before $20 million overall. Old Dominion Sports. Retrieved from: https://odusports.com/news/2024/05/9/minium-odus-baseball-series-against-app-state-is-the-last-at-bud-metheny-stadium-before-dollar20-million-overhaul
- MLB.com (2023). Newest ballparks in Minor League Baseball. MLB.com. Retrieved from: https://www.mlb.com/news/featured/newest-ballparks-in-minor-league-baseball
- Noll, R. (1974). Attendance and price setting. In RG Noll (Ed.), Government and the Sport Business. Washington D.C.; The Brookings Institute.
- Noll, R. and Zimbalist, A. (1997). Build the stadium create the bobs! In R.G. Noll and Zimbalist (Eds.), Sports, Jobs and Taxes, Washington, D.C.: The Brookings Institute.
- Perry, K. (2001). Professional sports attendance as a proxy for new stadium spillover benefits. The Park Place Economist, 9, 62-70.
- Popp, N., Richards, J. and Weight, E. (2018). Measuring the impact of a significant college baseball stadium project on recruiting, on-field success, and fan attendance. Journal of Contemporary Athletics, 12(3), 175-188.
- Porat, A. (2010). Football fandom: A bounded identification. Soccer and Society, 11(3), 277-290.
- Quinn, K., Bursik, P., Borick, C., and Raethz, L. (2003). Do new digs mean more wins? The relationship between a new venue and a professional sports team’s competitive success. Journal of Sports Economics, 4(3), 167-182.
- Reichard, P. (2017, September 6). 2017 ballpark of the year: SunTrust Park, Atlanta Braves. Ballpark Digest. Retrieved from: https://ballparkdigest.com/2017/09/06/2017-ballpark-of-the-year-suntrust-park-atlanta-braves/
- Samra, B. and Wos, A. (2014). Consumer in sports; Fan typology analysis. Journal of Intercultural Management, 6(4), 263-288.
- Sheade, B. (2021, April 15). The most and least valuable MLB teams. Chicago Tribune. Retrieved from: https://www.chicagotribune.com/2021/04/15/the-most-and-least-valuable-mlb-teams/
- van Ours, J. (2024). No novelty effect but a honeymoon that lasts: On the attendance effects of new football stadiums. Sports Economics Review, 5, 1-14.
- Voight, D. (1983). American Baseball Volume 3; From Postwar Expansion to the Electronic Age. State College, PA: Pennsylvania College University Press.
- Watson, J. and Krantz III, A. (2003). Home field advantage: New stadium construction and team performance in professional sports. Perceptual and Motor Skills, 97(3), 794-796.
- Zygmont, Z. and Leadley, J. (2005). When is the honeymoon over? Major league baseball attendance 1970-2000. Journal of Sport Management, 19(3), 278-299.


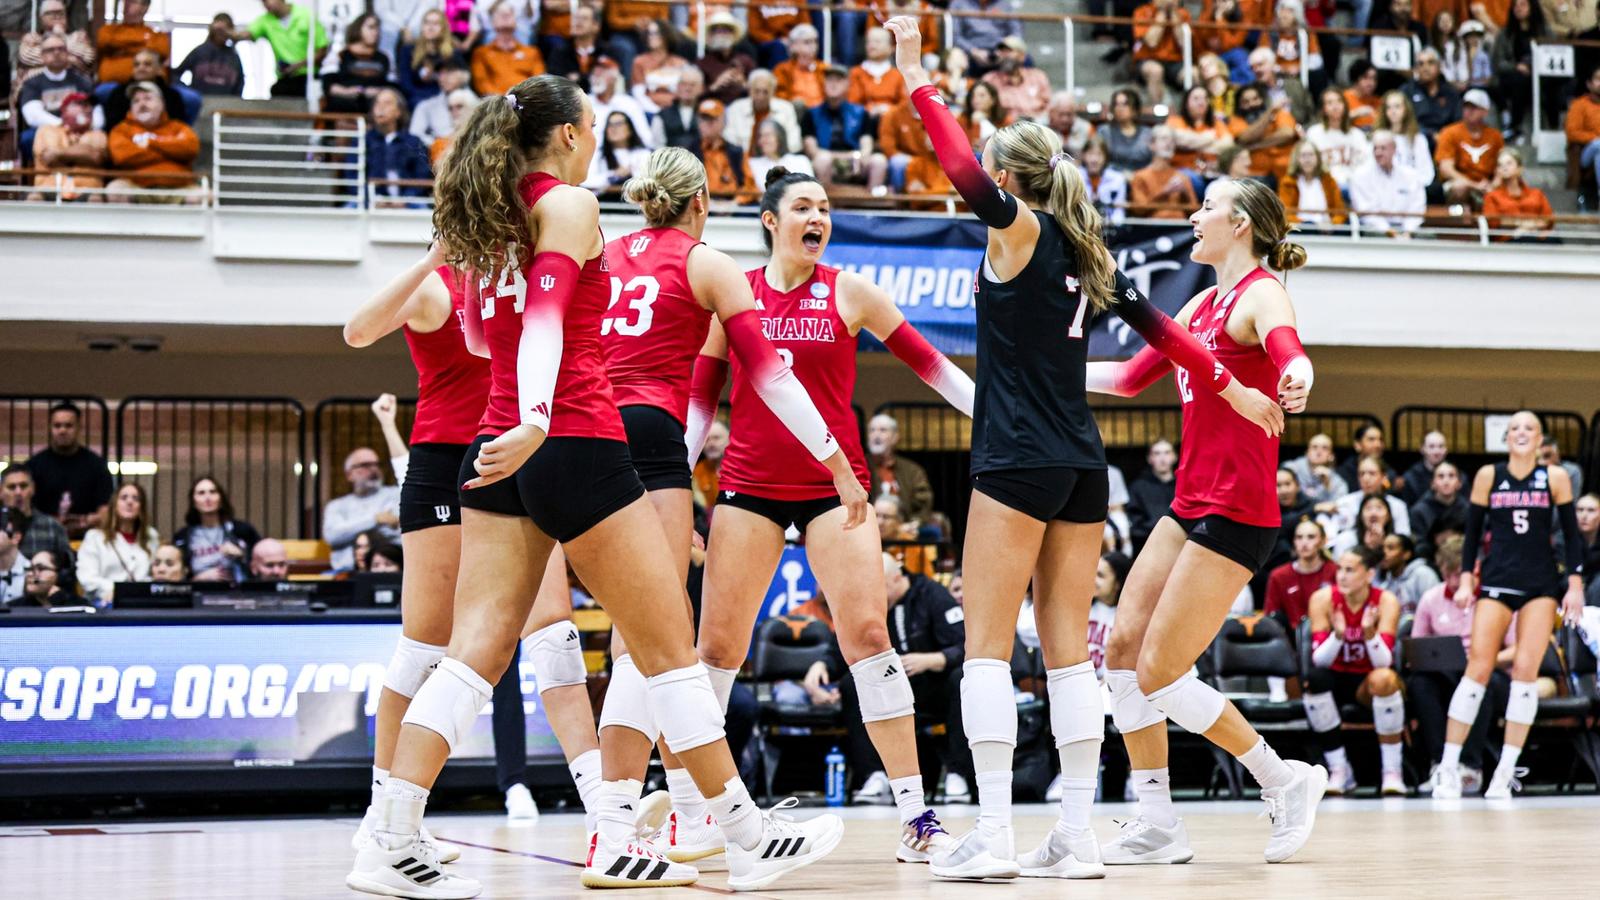
In one of the premier volleyball arenas in the country, the Hoosiers went blow-for-blow with the four-time national champions. IU lost by just a combined 11 points and reached the red zone (20+) in all three sets. Head coach Steve Aird‘s group recorded more kills (48-45) but couldn’t find a defensive answer for Texas’ All-American outside hitter Torrey Stafford.
Senior outside hitter Candela Alonso-Corcelles recorded 13 kills in her final game with the Hoosiers. It was the 74th time in her college tenure that she recorded a match with at least 10 kills. IU found great success in the middle with seven kills (.778) from senior middle blocker Madi Sell and eight kills (.700) from freshman middle blocker Victoria Gray.
Contributions from freshmen were felt from every part of the court. Freshman setter Teodora Krickovic dished out 38 assists while freshman outside hitter Jaidyn Jager contributed eight kills. Freshman outside hitter Charlotte Vinson had an ace and picked up her first career kill for the Hoosiers. Six of IU’s 10 players on the court were true freshmen on Friday.
In totality, IU’s 2025 team will go down as the greatest in program history. The Hoosiers broke single-season program records in the NCAA era for wins (25), regular season wins (23), Big Ten wins (14), road wins (9), ranked road wins (3). IU advanced to its second NCAA regional semifinal in school history.
How it Happened
• The defensive effort made the difference for Texas on Friday afternoon. The Longhorns racked up 10 more blocks than the Hoosiers (12.0-2.0). IU dug 38 balls but struggled to find points in transition. Texas had an answer for every IU swing in the match.
• Texas’ All-American outside hitter Torrey Stafford was virtually unstoppable on Friday. She picked up 19 kills on zero errors for a .679 hitting percentage. She dug eight balls and had a hand in four blocks as well. IU had more kills (48-46) but had 23 attacking errors.
Top Hoosier Performers
#3 Alonso-Corcelles, Candela
13 kills, 10 digs
#10 Krickovic, Teodora
38 assists, 7 digs, 2 kills
#23 Gray, Victoria
8 kills, .700 hitting percentage
Notes to Know
• Senior outside hitter Candela Alonso-Corcelles played her final career game for the Hoosiers. She provided 13 kills in the match, the 74th time that she’s had double-digit kills in a contest. She ends her career eighth in program history in kills (1,386). She’s the first IU player since Jordan Haverly (2009, 2010) with consecutive seasons of 400+ kills.
• The Hoosiers ended the 2025 season hitting .281 as a team. That is a new single-season program record, obliterating the previous IU standard (.246) from 1989. All three of IU’s pin hitters and all three middle blockers that played regular time finished with a hitting efficiency of .240 or better on the year.
• For players with at least 300 attempts in a season, freshman middle blocker Victoria Gray finished the season hitting .378 with 152 kills. That mark puts her second in a single season in program history while smashing the previous single-season freshman hitting percentage record.
• Senior opposite hitter Avry Tatum finished her IU career with a collective hitting percentage of .273 with 936 kills on more than 2,000 swings. Among all pin hitters in program history, no IU player hit at a better efficiency (min. 1,000 attempts) than Tatum did in her three seasons in Bloomington.

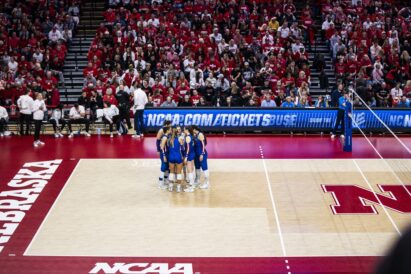
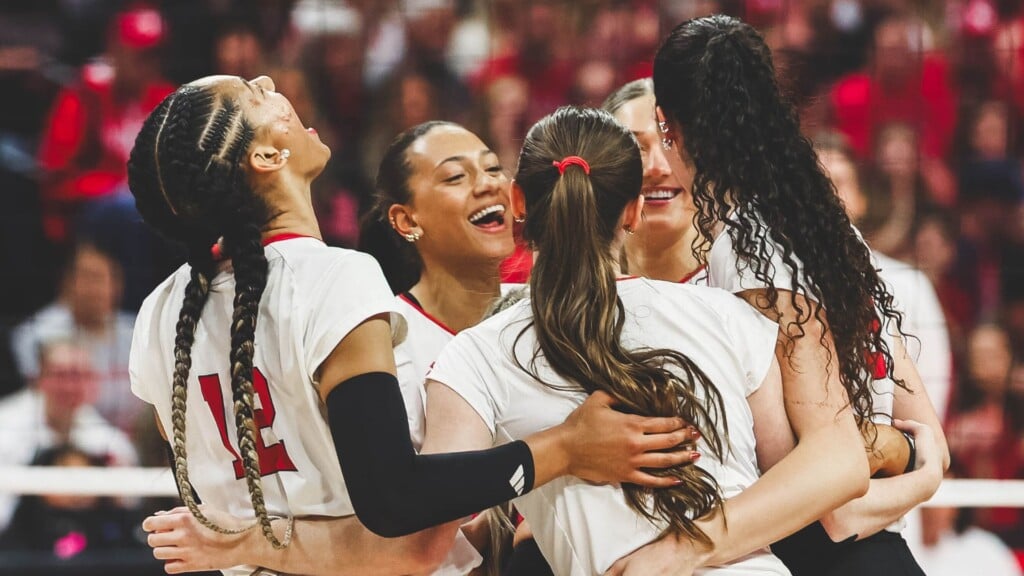
Kansas Athletics
The Kansas volleyball team huddles during its match against Nebraska on Friday, Dec. 12, 2025, in Lincoln, Neb.
A promising season of Kansas volleyball under the guidance of first-year head coach Matt Ulmer came to a grim end on Friday night in Lincoln, Nebraska, as the Jayhawks found themselves on the receiving end of a dominant 3-0 sweep (25-12, 25-11, 25-12) by the host Cornhuskers at the Bob Devaney Sports Center.
KU was overmatched in all phases against No. 1 overall seed Nebraska (33-0), which has still lost just one set at home all season and hit .450 against a usually rock-solid defense. The Jayhawks did not record a block until they trailed 20-10 in the final set, while senior libero Ryan White was limited to five digs in her final collegiate match.
Middle blocker Reese Ptacek, outside hitter Rhian Swanson and opposite hitter Jovana Zelenović accounted for six kills apiece, but they came on 15, 30 and 22 attacks, respectively. Katie Dalton recorded 11 assists, and Cristin Cline had eight.
Meanwhile, Nebraska’s Rebekah Allick recorded a kill all nine times she swung. The Cornhuskers’ setter Bergen Reilly, the Big Ten’s player and setter of the year, finished with 30 assists. Middle blocker Andi Jackson equaled Allick with nine more kills.
At the service line, the Jayhawks committed six errors with one ace.
“You’re really having to nitpick to try to figure out what to do to make (Nebraska) uncomfortable and you have to just execute at a much higher level than what we were able to do,” KU coach Matt Ulmer told reporters after the match. “We tried to serve some different spots, they held out pretty good. We tried to serve aggressive, but then you can’t miss too much. I just thought we had to be much cleaner from the service line to even apply some pressure.”
The Huskers didn’t let any of the three sets remain close for long, but they certainly opened the match with a bang as they came out with a 10-1 run capped off by consecutive aces by Olivia Mauch on reception errors by Logan Bell. The Jayhawks were able to get Zelenović going a bit with three kills late in the set, but the margin never got close, thanks in large part to Allick’s performance.
KU looked briefly like it might hang around longer in the second set when a kill by Dalton cut its deficit to 9-7. But Nebraska proceeded to score the next four times, while the Jayhawks only got four points the rest of the set.
The Huskers weren’t going to slip up and lose a set at home for the first time since Sept. 12. Instead, they strung together another 7-1 run early, featuring a couple of kills by Teraya Sigler, and never looked back.
The result brought a decisive end to the Jayhawks’ season in the Sweet 16, with one of their primary goals still accomplished as they had managed to make it out of the first weekend for the first time since 2021. They concluded the campaign with a record of 24-11 and a second-place finish in the Big 12 Conference.
“For us, as not good as right now feels, it’s been a great year for us and it’s been a great season and we’ve achieved so much, so I’m really proud of them,” Ulmer said. “I know it’s hard to feel that in the moment, but big picture, it was a great year for Kansas.”
The Jayhawks will have some holes to fill with six players having gone through senior day, including key contributors Dalton, Swanson and White. However, many of their top players were underclassmen, including a trio of international freshmen.
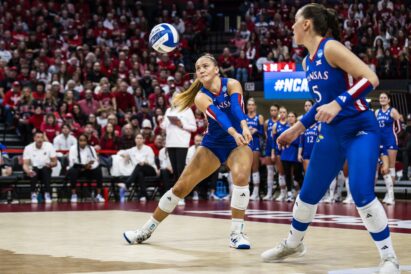 Kansas Athletics
Kansas pin hitter Grace Nelson makes a pass against Nebraska on Friday, Dec. 12, 2025, in Lincoln, Neb.
PREV POST
Jon Jon Kamara will transfer away from KU football
NEXT POST
KU volleyball knocked out by unbeaten Nebraska in Sweet 16 sweep

Written By Henry Greenstein

LINCOLN, Neb. (KLKN) — The No. 1-ranked Nebraska volleyball team took care of business Friday night, sweeping Kansas in the regional semifinal of the NCAA Tournament.
The Huskers won 25-12, 25-11, 25-12 at the Bob Devaney Center.
As a team, the Huskers boasted a .450% hitting percentage, compared to the Jayhawks’ .029%.
It was both middle blockers for Nebraska that paved the path to victory.
Rebekah Allick and Andi Jackson each had a team-high nine kills. Allick finished the match with a perfect 1.000% hitting percentage, and Jackson had a team-high five blocks.
Harper Murray followed close behind with seven kills and a .238% hitting percentage. She also tallied a team-high 10 digs.
Bergen Reilly led an efficient offense with 30 assists, and Olivia Mauch racked up three aces.
The Huskers will face off against Texas A&M on Sunday for a chance to go to the Final Four in Kansas City.
First serve is set for 2 p.m. on ABC.

Highlighting the 13 who graduated this fall were eight members of the K-State football team, and one each from the baseball, volleyball, rowing, soccer and women’s track and field programs.
The group of graduates was also honored Friday at the department’s annual graduation reception.
K-State continues to rank among the league’s best in terms of academic success as all programs are currently well above the required NCAA APR standard in addition to ranking among the best in the Big 12 in graduation rates – including five teams that have Big 12-leading marks this year.
2025 Fall Graduates
Baseball
Cadyn Karl, Finance
Football
JB Bradley, Integrative Human Sciences
Jet Dineen, Communications
Sam Hecht, Construction Science and Management
Damian Ilalio, Athletic Training and Rehab Sciences
Jacob Knuth, Management
Isaac Koch, Finance
Sterling Lockett, Management
Brayden Loftin, Kinesiology
Rowing
Emma Johnson (Jaelley), Elementary Education
Volleyball
Ava LeGrand, Finance
Soccer
Paige Dickson, Life Sciences
Women’s Track and Field
Brooklyn Jones, Integrative Human Sciences
Dec. 12, 2025Updated Dec. 13, 2025, 12:33 a.m. CT
AUSTIN, Texas – Wisconsin volleyball will be spending two more days in Austin.
The Badgers ensured that with a four-set win over Stanford on Dec. 12 in the NCAA tournament regional semifinals. It was the eighth consecutive win in the regional semifinals for Kelly Sheffield’s group and its first-ever win over Stanford in program history.
Here’s what to know about Wisconsin’s next match:

Who will Wisconsin volleyball play next?
Wisconsin’s next match will be against top-seeded Texas in the NCAA tournament regional finals, with the winner advancing to the Final Four.
What time is Wisconsin volleyball’s next match?
The Wisconsin-Texas match will be on Sunday, Dec. 14 at 6:30 p.m. CT.
How to watch Wisconsin-Texas NCAA tournament regional finals match?

NCAA volleyball tournament bracket for regional finals
- Creighton vs. Kentucky on Dec. 13 at 5 p.m. in Lexington, Kentucky
- Purdue vs. Pittsburgh on Dec. 13 at 7:30 p.m. in Pittsburgh
- Wisconsin vs. Texas on Dec. 14 in Austin
- Winner of Nebraska/Kansas vs. winner of Louisville/Texas A&M on Dec. 14 in Lincoln, Nebraska

ANCHORAGE (Dec. 12) – Riding the momentum from an outstanding 2025 season, the Alaska Anchorage volleyball team has begun reloading for future success with the signing of Alaska prep stars Indy Kmet, Vaiula Leaoa and Sophie Tapley, head coach Stacie Meisner announced Friday.
The newest Seawolves hail from all over the state and represent three of the four classifications in Alaska high school volleyball – 2A, 3A and 4A.
“We are fortunate to live in a state with great coaching at the developmental and high school levels, which has been proven by the contributions of high-level Alaskans who have come through our program,” said Meisner, whose team went 23-6 and tied for the Great Northwest Athletic Conference title this season. “We are thrilled that Indy, Ula and Sophie have decided to continue the tradition and welcome them to the Seawolf family.”
A 6-1 outside hitter, Kmet led South Anchorage to the Cook Inlet Conference regular-season title and an ASAA 4A State Tournament berth, along with earning MVP honors at the prestigious Dimond/Service tournament. She was also a key member of the 2024 South squad that finished state runner-up, making the ASAA All-Tournament Team as a junior.
Coach Meisner says…
“Indy is a strong athlete who we had the opportunity to work with at camp over the summer. She is incredibly coachable and a great all-around player with a lot of potential for continued improvement. She has impressive instincts on defense and puts up a big block in the front row. We are excited to see what she will bring to the table next fall to only increase the physicality of our roster.”
A 6-foot outside hitter, Leaoa finished a legendary career at Unalaska last month, leading the Raiders to a second consecutive 2A state title and a 39-match win streak to end her career. The Outstanding Hitter award-winner at this year’s state tournament, she ripped 19 kills in the title-match sweep of Su Valley.
Coach Meisner says…
“Ula is a really special player out of Dutch Harbor; it’s not often we see a player of her caliber coming from rural Alaska, and we are thrilled that she wanted to join our program. She is already very athletic and physical, with a big jump and a heavy arm swing. She also came to camp in July, so we got to work directly with her, and I believe her ceiling is going to be incredibly high.”
A 5-8 rightside hitter, Tapley led Kenai Central to its third 3A state championship in four seasons this year, earning Outstanding Hitter and All-Tournament honors. Tapley, who only started playing volleyball in seventh grade, was also an all-tournament selection at the 2024 state tournament.
Coach Meisner says…
“Sophie is a springy, left-handed attacker who sees the court well and plays an aggressive game. Her size is deceiving as she jumps incredibly well and has a very fast arm on her attack. We look forward to seeing how she will develop and continue to grow.”
The trio gives UAA five Alaskans on its 2026 roster, joining sophomore rightside hitter Emma Beck (Kenai) and sophomore libero/defensive specialist Eleasha Sapon (Anchorage/Dimond).

Registration open for YMCA Winter Programs! (sponsored) | Brooklyn Bridge Parents

$15 million college football coach sues Big Ten school over buyout dispute

What The University of Utah’s $500M Private Equity Deal Means for the Future of Youth Sports

From Troubled Youth To NFL Star: Garett Bolles’ Journey

Corpus Christi expands youth sports access with affordable field rentals

Full 2026 Championships Schedule Finalized

Historic Season Comes to Close

Muskego Youth Sports Director faces Federal Sex Crime Charges

Sam Corry Back With Nitro for 2 ARCA Races

City honors Karon Lewis with first Dave Miletich Volunteer Coach of the Year Award

KU volleyball knocked out by unbeaten Nebraska in Sweet 16 sweep

Meet The Two Oregon Freshmen Ready To Make Ducks History Under Dan Lanning

IHRA Announces Acquisition of Maple Grove Raceway

No. 1 Nebraska volleyball powers past Kansas, sets regional final date with Texas A&M

Thirteen Student-Athletes Earn Degrees in Fall

First Tee Winter Registration is open

Fargo girl, 13, dies after collapsing during school basketball game – Grand Forks Herald

CPG Brands Like Allegra Are Betting on F1 for the First Time

Volleyball Recaps – November 18

F1 Las Vegas: Verstappen win, Norris and Piastri DQ tighten 2025 title fight

Two Pro Volleyball Leagues Serve Up Plans for Minnesota Teams

Sycamores unveil 2026 track and field schedule

Utah State Announces 2025-26 Indoor Track & Field Schedule
Jo Shimoda Undergoes Back Surgery

Redemption Means First Pro Stock World Championship for Dallas Glenn

Robert “Bobby” Lewis Hardin, 56

How this startup (and a KC sports icon) turned young players into card-carrying legends overnight

Texas volleyball vs Kentucky game score: Live SEC tournament updates

Bowl Projections: ESPN predicts 12-team College Football Playoff bracket, full bowl slate after Week 14

Indiana’s rapid ascent and its impact across college football

 NBA Legend Michael Jordan to Join NBC Sports as Special Contributor
 Why a rising mid-major power with an NCAA Tournament team opted out of revenue-sharing — and advertised it
 Falcons mailbag
 Portal Update – Basketball and Gymnastics Take Hits
 has always dreamed in Mercurial. Now his initials are on the boots.
The new Kyl…
has always dreamed in Mercurial. Now his initials are on the boots.
The new Kyl…
-
 Rec Sports3 weeks ago
First Tee Winter Registration is open
-
 Rec Sports2 weeks ago
Fargo girl, 13, dies after collapsing during school basketball game – Grand Forks Herald
-
 Motorsports3 weeks ago
CPG Brands Like Allegra Are Betting on F1 for the First Time
-
 Motorsports3 weeks ago
F1 Las Vegas: Verstappen win, Norris and Piastri DQ tighten 2025 title fight
-
 Sports3 weeks ago
Two Pro Volleyball Leagues Serve Up Plans for Minnesota Teams
-
 Sports3 weeks ago
Sycamores unveil 2026 track and field schedule
-
 Sports3 weeks ago
Utah State Announces 2025-26 Indoor Track & Field Schedule
-
 Motorsports2 weeks ago
Redemption Means First Pro Stock World Championship for Dallas Glenn
-

 Motorsports2 weeks ago
Jo Shimoda Undergoes Back Surgery
-
 Rec Sports2 weeks ago
Robert “Bobby” Lewis Hardin, 56