Connect with us

Technology

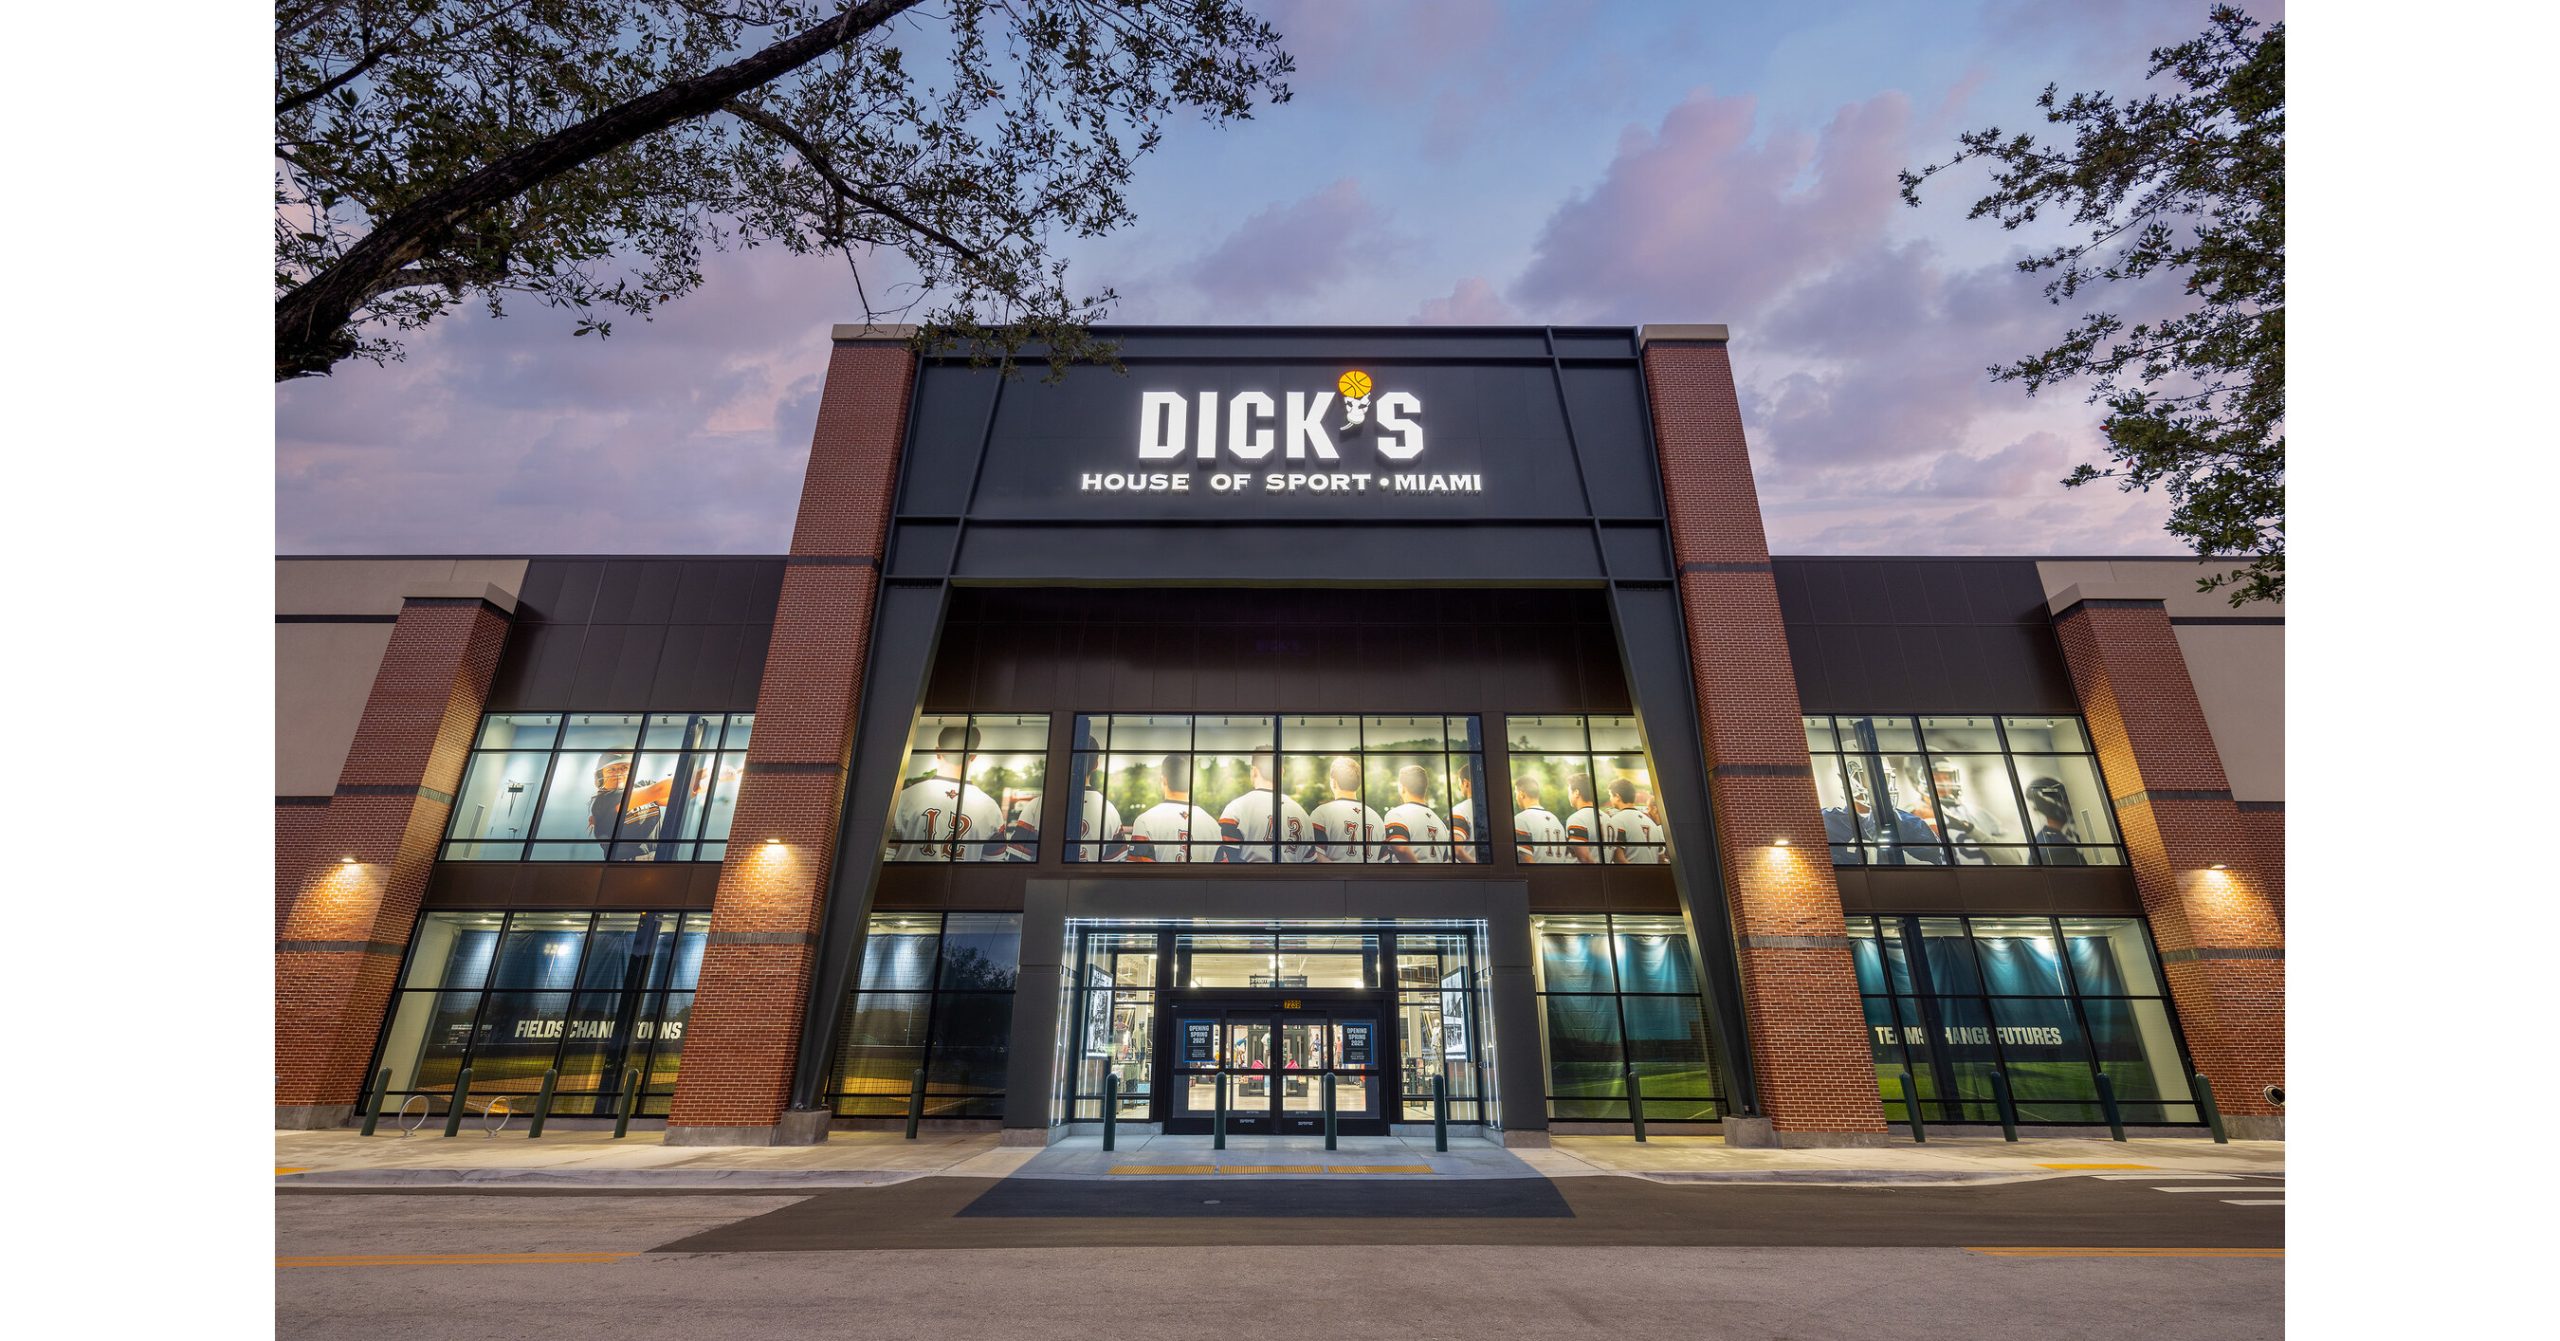
DICK’S Sporting Goods Reports First Quarter Results; Delivers Record First Quarter Sales and 4.5% Comparable Sales Growth

  First Quarter Operating Results (dollars in millions, except per share data) 13 Weeks Ended Change (7) May 3, 2025 May 4, 2024 Net sales $ 3,175 $ 3,018 $ 156 5.2 % Comparable sales (1) 4.5 % 5.3 % Income before income taxes (% of net sales) (2) 11.0 % 11.3 % (39) bps Non-GAAP income before income taxes […]

Published

on


First Quarter Operating Results

(dollars in millions, except per share data)

13 Weeks Ended

Change (7)

May 3, 2025

May 4, 2024

Net sales

$

3,175

$

3,018

$

156

5.2 %

Comparable sales (1)


4.5 %


5.3 %


Income before income taxes (% of net sales) (2)


11.0 %


11.3 %


(39) bps

Non-GAAP income before income taxes (% of net sales) (2) (3)


11.4 %


11.3 %


5 bps

Effective tax rate


24.0 %


19.6 %


441 bps

Net income

$

264

$

275

$

(11)

(4) %

Non-GAAP net income (3)

$

275

$

275

$

(1)

— %

Earnings per diluted share

$

3.24

$

3.30

$

(0.06)

(2) %

Non-GAAP earnings per diluted share (3)

$

3.37

$

3.30

$

0.07

2 %


Balance Sheet

(in millions)

As of

May 3, 2025

As of

May 4, 2024

$

Change (7)

%

Change (7)

Cash and cash equivalents

$

1,036

$

1,649

$

(613)

(37) %

Inventories, net

$

3,569

$

3,201

$

368

12 %

Total debt (4)

$

1,484

$

1,483

$

1

— %


Capital Allocation

(in millions)

13 Weeks Ended

$

Change (7)

%

Change (7)

May 3, 2025

May 4, 2024

Share repurchases (5)

$

299

$

114

$

185

163 %

Dividends paid (6)

$

100

$

94

$

6

6 %

Gross capital expenditures

$

265

$

158

$

107

68 %

Net capital expenditures (3)

$

242

$

126

$

116

92 %

Notes

(1)

Beginning in fiscal 2025, we revised our method for calculating comparable sales to include Warehouse Sale stores beginning in the stores’ 14th full month of operations, similar to our other store locations. Prior year information has been revised to reflect this change for comparability purposes. See additional details as furnished in Exhibit 99.2 of the Company’s Current Report on Form 8-K, filed with the SEC on March 11, 2025.

(2)

Also referred to by management as earnings before income taxes (“EBT”).

(3)

For additional information, see GAAP to non-GAAP reconciliations included in tables later in the release under the heading “GAAP to Non-GAAP Reconciliations.” In the fiscal 2024 period, there were no non-GAAP adjustments to reported EBT margin, net income or earnings per diluted share.

(4)

The Company had no outstanding borrowings under its revolving credit facility in 2025 and 2024.

(5)

During the 13 weeks ended May 3, 2025, the Company repurchased 1.4 million shares of its common stock under its previously announced share repurchase program at an average price of $218.65 per share, for a total cost of $298.7 million. The Company has $212.9 million remaining under this authorization as of May 3, 2025. The Company also paid $5 million during fiscal 2025 for shares repurchased during fiscal 2024.

(6)

The Company declared and paid quarterly dividends of $1.2125 per share in fiscal 2025 and $1.10 per share in fiscal 2024.

(7)

Column may not recalculate due to rounding.

Quarterly Dividend

On May 27, 2025, the Company’s Board of Directors authorized and declared a quarterly dividend in the amount of $1.2125 per share on the Company’s common stock and Class B common stock. The dividend is payable in cash on June 27, 2025 to stockholders of record at the close of business on June 13, 2025.

Agreement to Acquire Foot Locker

On May 15, 2025, the Company announced that it entered into a definitive merger agreement to acquire Foot Locker, Inc., a leading footwear and apparel retailer. Under the terms of the merger agreement, Foot Locker shareholders will elect to receive either (i) $24.00 in cash or (ii) 0.1168 shares of DICK’S Sporting Goods common stock for each share of Foot Locker common stock, for a total equity value of approximately $2.4 billion and an enterprise value of approximately $2.5 billion. The completion of the acquisition is subject to Foot Locker shareholder approval and other customary closing conditions, including regulatory approvals, and is expected to close in the second half of 2025. The Company intends to finance the acquisition through a combination of cash-on-hand, revolving borrowings and other new debt, to the degree Foot Locker shareholders do not elect to receive their consideration entirely in shares of the Company’s common stock.

Full Year 2025 Outlook (1)

The Company’s Full Year Outlook for 2025 presented below does not include acquisition-related costs, investment losses or results from the recently announced plan to acquire Foot Locker:

Metric

2025 Outlook

Earnings per diluted share

●       $13.80 to 14.40

○        Based on approximately 81 million diluted shares outstanding

○        Based on an effective tax rate of approximately 24%

○        Includes the expected impact from all tariffs currently in effect

Net sales

●       $13.6 billion to 13.9 billion

Comparable sales

●       Positive 1.0% to positive 3.0%

Capital expenditures

●       Approximately $1.2 billion on a gross basis

●       Approximately $1.0 billion on a net basis


(1)

Please see the section of this document titled “Non-GAAP Financial Measures” for more information.

Store Count and Square Footage

The following table summarizes store activity for fiscal 2025:


Beginning
Stores

New
Stores

Closed
Stores

Relocated /
Converted (5)

Ending
Stores

(in millions)

Square Footage (6) (7)

Beginning

Ending

DICK’S Sporting Goods (1)

DICK’S (2)

677

(2)

(5)

670

36.3

35.9

DICK’S Field House (2)

27

1

3

31

1.6

1.8

DICK’S House of Sport

19

2

21

2.2

2.5

Total DICK’S Sporting Goods

723

1

(2)

722

40.1

40.1


Other Specialty Concepts (1)

Golf Galaxy (3)

109

1

110

2.4

2.4

Going Going Gone! (4)

50

2

(2)

50

2.2

2.3

Other

3

3

0.1

0.1

Total Other Specialty Concepts

162

3

(2)

163

4.8

4.8

Total (4)

885

4

(4)

885

44.8

45.0


(1)

In some markets, we operate DICK’S Sporting Goods stores adjacent to our specialty concept stores on the same property with a pass-through for our athletes. We refer to this format as a “combo store” and include combo store openings within both the DICK’S Sporting Goods and specialty concept store reconciliations, as applicable. As of May 3, 2025, the Company operated 14 combo stores.

(2)

Beginning store count and square footage were updated to reflect one DICK’S Field House location that opened in fiscal 2024, which was previously reflected as a DICK’S store.

(3)

As of May 3, 2025, includes 27 Golf Galaxy Performance Centers, with three new openings during fiscal 2025, two of which were conversions of prior Golf Galaxy store locations.

(4)

Beginning store count and square footage were updated to reflect Warehouse Sale locations as described in the Company’s Current Report on Form 8-K, filed with the SEC on March 11, 2025. As of February 2, 2025, beginning amounts now include 29 Warehouse Sale locations and 1.3 million of related square footage.

(5)

Reflects stores converted between concept or prototype through store relocations or remodels as part of the Company’s strategy to reposition its store portfolio. Including stores that converted between concepts, the Company relocated three stores during the current year period.

(6)

Includes square footage as of May 3, 2025 related to five Public Lands store closures as we plan to convert three into DICK’S House of Sport and two into DICK’S Field House stores during fiscal 2025.

(7)

Columns may not recalculate due to rounding.

Non-GAAP Financial Measures

In addition to reporting the Company’s financial results for the first quarter in accordance with generally accepted accounting principles (“GAAP”), the Company reports certain financial results for that quarter that differ from what is reported under GAAP. These non-GAAP financial measures include non-GAAP gross margin, non-GAAP operating margin (also referred to as non-GAAP EBIT margin), non-GAAP EBT margin, non-GAAP net income, non-GAAP earnings per diluted share and net capital expenditures, which management believes provides investors with useful supplemental information to evaluate the Company’s ongoing operations and to compare with past and future periods. Furthermore, management believes that adjustments related to its deferred compensation plans enables investors to better understand its selling, general and administrative expense trends by excluding non-cash changes in our deferred compensation plan investment fair values from market fluctuations that are offset within other income. Management also uses these non-GAAP measures internally for forecasting, budgeting, and measuring its operating performance. These measures should be viewed as supplementing, and not as an alternative or substitute for, the Company’s financial results prepared in accordance with GAAP. The methods used by the Company to calculate its non-GAAP financial measures may differ significantly from methods used by other companies to compute similar measures. As a result, any non-GAAP financial measures presented herein may not be comparable to similar measures provided by other companies. A reconciliation of the Company’s non-GAAP measures to the most directly comparable GAAP financial measures are provided below and on the Company’s website at investors.DICKS.com.

Information reconciling certain forward-looking GAAP measures to non-GAAP measures related to full-year 2025 outlook and guidance, including earnings per diluted share, net sales, comparable sales and capital expenditures, in each case presented herein on a non-GAAP basis due to the exclusion of acquisition-related costs, investment losses and results from the recently announced plan to acquire Foot Locker, is not available without unreasonable effort due to high variability, complexity and uncertainty involved in forecasting and quantifying certain amounts with respect to and resulting from the planned acquisition that are necessary for such reconciliations. For those reasons, we are unable to address the probable significance of the unavailable information, which could have a potentially unpredictable, and potentially significant, impact on our future GAAP financial results.

Forward-Looking Statements Involving Known and Unknown Risks and Uncertainties

This release contains forward-looking statements made pursuant to the safe harbor provisions of the Private Securities Litigation Reform Act of 1995. Forward-looking statements can be identified as those that may predict, forecast, indicate or imply future results or performance and by forward-looking words such as “believe”, “anticipate”, “expect”, “estimate”, “predict”, “intend”, “plan”, “project”, “goal”, “will”, “will be”, “will continue”, “will result”, “could”, “may”, “might” or any variations of such words or other words with similar meanings. Any statements about DICK’S Sporting Goods, Inc.’s (“DICK’S Sporting Goods”), Foot Locker, Inc.’s (“Foot Locker”) or the combined company’s plans, objectives, expectations, strategies, beliefs, or future performance or events constitute forward-looking statements. These statements are subject to known and unknown risks, uncertainties, assumptions, estimates, and other important factors that change over time, many of which may be beyond DICK’S Sporting Goods’, Foot Locker’s and the combined company’s control. DICK’S Sporting Goods’, Foot Locker’s and the combined company’s future performance and actual results may differ materially from those expressed or implied in such forward-looking statements. Forward-looking statements should not be relied upon as a prediction of actual results. Forward-looking statements include statements regarding, among other things, the Company’s future performance and growth opportunities, including 2025 guidance, continued comp growth, strategic investments and square footage expansion, and improved gross margin; the benefits of the combination of DICK’S Sporting Goods and Foot Locker (the “Transaction”), future financial and operating results and the combined company’s plans, objectives, expectations, intentions, growth strategies and culture and other statements that are not historical facts.

Factors that could cause actual results to differ materially from those expressed or implied in any forward-looking statements include, but are not limited to, current macroeconomic conditions, including prolonged inflationary pressures, potential changes to international trade relations, geopolitical conflicts and adverse changes in consumer disposable income; supply chain constraints, delays and disruptions; fluctuations in product costs and availability due to tariffs, currency exchange rate fluctuations, fuel price uncertainty and labor shortages; changes in consumer demand for products in certain categories and consumer lifestyle changes; intense competition in the sporting goods industry; the overall success of DICK’S Sporting Goods’, Foot Locker’s and the combined company’s strategic plans and initiatives; DICK’S Sporting Goods’, Foot Locker’s and the combined company’s vertical brand strategy and plans; DICK’S Sporting Goods’, Foot Locker’s and the combined company’s ability to optimize their respective distribution and fulfillment networks to efficiently deliver merchandise to their stores and the possibility of disruptions; DICK’S Sporting Goods’, Foot Locker’s and the combined company’s dependence on suppliers, distributors, and manufacturers to provide sufficient quantities of quality products in a timely fashion; the potential impacts of unauthorized use or disclosure of sensitive or confidential customer, employee, vendor or other information; the risk of problems with DICK’S Sporting Goods’, Foot Locker’s and the combined company’s information systems, including e-commerce platforms, and any associated disruptions to operations; DICK’S Sporting Goods’, Foot Locker’s and the combined company’s ability to attract and retain customers, executive officers and employees; our investments in GameChanger, our sports technology platform, DICK’S Media Network, and other technology to enhance our store fulfillment, in-store pickup and other foundational capabilities; potential reputational harm; our athlete experiences and associated costs, innovation, liability and competition associated with our specialty stores and vertical brands; increasing labor costs; the effects of the performance of professional sports teams within DICK’S Sporting Goods’, Foot Locker’s and the combined company’s core regions of operations; DICK’S Sporting Goods’, Foot Locker’s and the combined company’s ability to control expenses and manage inventory shrink; the seasonality of certain categories of DICK’S Sporting Goods’, Foot Locker’s and the combined company’s operations and weather-related risks; changes in applicable tax laws, regulations, treaties, interpretations and other guidance; product safety and labeling concerns; the projected range of capital expenditures of DICK’S Sporting Goods, Foot Locker and the combined company, including costs associated with new store development, relocations and remodels and investments in technology; plans to return capital to stockholders through dividends and share repurchases, if any; DICK’S Sporting Goods’, Foot Locker’s and the combined company’s ability to meet market expectations; the influence of DICK’S Sporting Goods’ Class B common stockholders and associated possible scrutiny and public pressure; compliance and litigation risks, including changing rules, regulations and expectations related to environmental, social and governance matters and various types of litigation and other claims and sufficient insurance with respect thereto; DICK’S Sporting Goods’, Foot Locker’s and the combined company’s ability to protect their respective intellectual property rights or respond to claims of infringement by third parties; the availability of adequate capital; obligations and other provisions related to DICK’S Sporting Goods’, Foot Locker’s and the combined company’s indebtedness; DICK’S Sporting Goods’, Foot Locker’s and the combined company’s future results of operations and financial condition; the occurrence of any event, change or other circumstance that could give rise to the right of one or both of the parties to terminate the Transaction; the outcome of any legal proceedings that may be instituted against DICK’S Sporting Goods or Foot Locker, including with respect to the Transaction; the possibility that the Transaction does not close when expected or at all because required regulatory or shareholder approvals or other conditions to closing are not received or satisfied on a timely basis or at all (and the risk that such approvals may result in the imposition of conditions that could adversely affect the combined company or the expected benefits of the Transaction); the risk that the benefits from the Transaction, including anticipated cost synergies, may not be fully realized or may take longer to realize than expected; the ability to promptly and effectively integrate the businesses of DICK’S Sporting Goods and Foot Locker following the closing of the Transaction; the dilution caused by the issuance of shares of DICK’S Sporting Goods common stock in the Transaction; the possibility that a Transaction may be more expensive to complete than anticipated, including as a result of unexpected factors or events; the terms of the debt financing incurred in connection with the Transaction; reputational risk and potential adverse reactions of DICK’S Sporting Goods’ or Foot Locker’s customers, employees or other business partners; and the diversion of DICK’S Sporting Goods’ and Foot Locker’s management’s attention and time from ongoing business operations and opportunities due to the Transaction. These factors are not necessarily all of the factors that could cause DICK’S Sporting Goods’, Foot Locker’s or the combined company’s actual results, performance or achievements to differ materially from those expressed in or implied by any of the forward-looking statements. Other factors, including unknown or unpredictable factors, also could harm DICK’S Sporting Goods’, Foot Locker’s or the combined company’s results.

For additional information on these and other factors that could affect the Company’s actual results, see the risk factors set forth in the Company’s filings with the Securities and Exchange Commission (“SEC”), including the most recent Annual Report on Form 10-K, filed with the SEC on March 27, 2025. We operate in a highly competitive and rapidly changing environment; therefore, new risk factors can arise, and it is not possible for the Company to predict all such risk factors. The Company disclaims and does not undertake any obligation to update or revise any forward-looking statement in this press release, except as required by applicable law or regulation. Forward-looking statements included in this release are made as of the date of this release.

Additional Information about the Merger and Where to Find It

In connection with the Transaction, DICK’S Sporting Goods intends to file with the SEC a registration statement on Form S-4, which will include a proxy statement of Foot Locker that also constitutes a prospectus for the shares of DICK’S Sporting Goods common stock to be offered in the Transaction. Each of DICK’S Sporting Goods and Foot Locker may also file other relevant documents with the SEC regarding the Transaction. This communication is not a substitute for the proxy statement/prospectus or registration statement or any other document that DICK’S Sporting Goods or Foot Locker may file with the SEC. The definitive proxy statement/prospectus (if and when available) will be mailed to shareholders of Foot Locker. INVESTORS AND SECURITY HOLDERS ARE URGED TO READ THE REGISTRATION STATEMENT, PROXY STATEMENT/PROSPECTUS AND ANY OTHER RELEVANT DOCUMENTS THAT MAY BE FILED WITH THE SEC, AS WELL AS ANY AMENDMENTS OR SUPPLEMENTS TO THESE DOCUMENTS, CAREFULLY AND IN THEIR ENTIRETY WHEN THEY BECOME AVAILABLE BECAUSE THEY CONTAIN OR WILL CONTAIN IMPORTANT INFORMATION ABOUT DICK’S SPORTING GOODS, FOOT LOCKER, THE TRANSACTION AND RELATED MATTERS. Investors and security holders will be able to obtain free copies of the registration statement and proxy statement/prospectus (if and when available) and other documents containing important information about DICK’S Sporting Goods, Foot Locker and the Transaction once such documents are filed with the SEC through the website maintained by the SEC at www.sec.gov. Copies of the documents filed with the SEC by DICK’S Sporting Goods will be available free of charge on DICK’S Sporting Goods’ website at https://investors.dicks.com. Copies of the documents filed with the SEC by Foot Locker will be available free of charge on Foot Locker’s website at https://investors.footlocker-inc.com.

Participants in the Solicitation

DICK’S Sporting Goods, Foot Locker and certain of their respective directors and executive officers may be deemed to be participants in the solicitation of proxies in respect of the Transaction. Information about the directors and executive officers of DICK’S Sporting Goods is set forth in DICK’S Sporting Goods’ proxy statement for its 2025 annual meeting of stockholders, which was filed with the SEC on May 2, 2025 and is available at https://www.sec.gov/ix?doc=/Archives/edgar/data/0001089063/000108906325000054/dks-20250501.htm, under the headings “Corporate Governance,” “Director Compensation,” “Executive Compensation,” “Transactions with Related Persons” and “Stock Ownership,” DICK’S Sporting Goods’ Annual Report on Form 10-K for the fiscal year ended February 1, 2025, which was filed with the SEC on March 27, 2025 and is available at https://www.sec.gov/ix?doc=/Archives/edgar/data/1089063/000108906325000012/dks-20250201.htm, and to the extent holdings of DICK’S Sporting Goods securities by its directors or executive officers have changed since the amounts set forth in DICK’S Sporting Goods’ proxy statement for its 2025 annual meeting of stockholders, such changes have been or will be reflected on Initial Statements of Beneficial Ownership of Securities on Form 3 or Statements of Changes in Beneficial Ownership on Form 4, which are filed with the SEC. Information about the directors and executive officers of Foot Locker is set forth in Foot Locker’s proxy statement for its 2025 annual meeting of shareholders, which was filed with the SEC on April 10, 2025 and is available at https://www.sec.gov/ix?doc=/Archives/edgar/data/850209/000110465925033769/tm2425908-3_def14a.htm, under the headings “Governance,” “Director Compensation,” “Executive Compensation” and “Shareholder Ownership,” Foot Locker’s Annual Report on Form 10-K for the fiscal year ended February 1, 2025, which was filed with the SEC on March 27, 2025 and is available at https://www.sec.gov/ix?doc=/Archives/edgar/data/850209/000143774925009620/floc20241213_10k.htm, and to the extent holdings of Foot Locker securities by its directors or executive officers have changed since the amounts set forth in Foot Locker’s proxy statement for its 2025 annual meeting of shareholders, such changes have been or will be reflected on Initial Statements of Beneficial Ownership of Securities on Form 3 or Statements of Changes in Beneficial Ownership on Form 4, which are filed with the SEC.

Other information regarding the participants in the proxy solicitations and a description of their direct and indirect interests, by security holdings or otherwise, will be contained in the proxy statement/prospectus and other relevant materials to be filed with the SEC regarding the Transaction when such materials become available. Investors should read the proxy statement/prospectus carefully when it becomes available before making any voting or investment decisions. Copies of the documents filed with the SEC by DICK’S Sporting Goods and Foot Locker will be available free of charge through the website maintained by the SEC at www.sec.gov. Additionally, copies of documents filed with the SEC by DICK’S Sporting Goods will be available free of charge on DICK’S Sporting Goods’ website at https://investors.dicks.com and those filed by Foot Locker will be available free of charge on Foot Locker’s website at https://investors.footlocker-inc.com.

Conference Call Info 

The Company will host a conference call today at 8:00 a.m. Eastern Time to discuss the first quarter results. Investors will have the opportunity to listen to the earnings conference call over the internet through the Company’s website located at investors.DICKS.com. To listen to the live call, please go to the website at least fifteen minutes early to register, download, and install any necessary audio software. For those who cannot listen to the live webcast, it will be archived on the Company’s website for approximately twelve months.

About DICK’S Sporting Goods, Inc.

DICK’S Sporting Goods (NYSE: DKS) creates confidence and excitement by inspiring, supporting and personally equipping all athletes to achieve their dreams. Founded in 1948 and headquartered in Pittsburgh, the leading omni-channel retailer serves athletes and outdoor enthusiasts in more than 850 DICK’S Sporting Goods, Golf Galaxy, Public Lands and Going Going Gone! stores, online, and through the DICK’S mobile app. DICK’S also owns and operates DICK’S House of Sport and Golf Galaxy Performance Center, as well as GameChanger, a youth sports mobile platform for live streaming, scheduling, communications and scorekeeping.

Driven by its belief that sports have the power to change lives, DICK’S has been a longtime champion for youth sports and, together with its Foundation, has donated millions of dollars to support under-resourced teams and athletes through the Sports Matter program and other community-based initiatives. Additional information about DICK’S business, corporate giving and employment opportunities can be found on dicks.com, investors.dicks.com, sportsmatter.org, dickssportinggoods.jobs and on Instagram, TikTok, Facebook and X.

Contacts:

Investor Relations:
Nate Gilch, Senior Director of Investor Relations
DICK’S Sporting Goods, Inc.
[email protected]
(724) 273-3400

Media Relations:
(724) 273-5552 or [email protected]

Category: Earnings

DICK’S SPORTING GOODS, INC. AND SUBSIDIARIES

CONSOLIDATED STATEMENTS OF INCOME – UNAUDITED

(In thousands, except per share data)


13 Weeks Ended


May 3,

2025


% of

Sales (1)


May 4,

2024


% of

Sales


Net sales


$         3,174,677


100.00 %


$         3,018,383


100.00 %

Cost of goods sold, including occupancy and
   distribution costs


2,009,591


63.30


1,923,090


63.71


GROSS PROFIT


1,165,086


36.70


1,095,293


36.29


Selling, general and administrative expenses


785,528


24.74


743,399


24.63

Pre-opening expenses


13,442


0.42


21,095


0.70


INCOME FROM OPERATIONS


366,116


11.53


330,799


10.96


Interest expense


12,138


0.38


13,835


0.46

Other expense (income)


6,256


0.20


(25,392)


(0.84)


INCOME BEFORE INCOME TAXES


347,722


10.95


342,356


11.34


Provision for income taxes


83,434


2.63


67,061


2.22


NET INCOME


$            264,288


8.32 %


$           275,295


9.12 %


EARNINGS PER COMMON SHARE:


Basic


$                  3.33


$                 3.42


Diluted


$                  3.24


$                 3.30


WEIGHTED AVERAGE COMMON SHARES
   OUTSTANDING:


Basic


79,341


80,582


Diluted


81,478


83,346


(1) Column does not add due to rounding

DICK’S SPORTING GOODS, INC. AND SUBSIDIARIES

CONSOLIDATED BALANCE SHEETS – UNAUDITED

(In thousands)


May 3,

2025


May 4,

2024


February 1,

2025

ASSETS


CURRENT ASSETS:


Cash and cash equivalents


$             1,035,889


$             1,649,077


$            1,689,940

Accounts receivable, net


256,554


157,855


214,250

Income taxes receivable


4,138


3,738


4,920

Inventories, net


3,569,353


3,201,148


3,349,830

Prepaid expenses and other current assets


164,892


149,948


158,767

Total current assets


5,030,826


5,161,766


5,417,707


Property and equipment, net


2,268,866


1,750,634


2,069,914

Operating lease assets


2,396,687


2,262,793


2,367,317

Intangible assets, net


58,598


56,591


58,598

Goodwill


245,857


245,857


245,857

Deferred income taxes


29,510


25,746


52,684

Other assets


404,238


201,608


246,617

TOTAL ASSETS


$          10,434,582


$            9,704,995


$          10,458,694


LIABILITIES AND STOCKHOLDERS’ EQUITY


CURRENT LIABILITIES:


Accounts payable


$             1,542,749


$             1,476,444


$             1,497,743

Accrued expenses


629,484


616,947


653,324

Operating lease liabilities


496,129


485,854


503,236

Income taxes payable


83,489


102,356


30,718

Deferred revenue and other liabilities


360,568


340,572


395,041

Total current liabilities


3,112,419


3,022,173


3,080,062

LONG-TERM LIABILITIES:


Revolving credit borrowings


 Senior notes


1,484,462


1,483,496


1,484,217

Long-term operating lease liabilities


2,587,597


2,336,845


2,500,307

Other long-term liabilities


197,710


175,215


195,844

Total long-term liabilities


4,269,769


3,995,556


4,180,368

COMMITMENTS AND CONTINGENCIES


STOCKHOLDERS’ EQUITY:


Common stock


556


570


567

Class B common stock


236


236


236

Additional paid-in capital


1,483,461


1,448,098


1,495,329

Retained earnings


6,559,483


5,773,338


6,392,513

Accumulated other comprehensive loss


(430)


(389)


(755)

Treasury stock, at cost


(4,990,912)


(4,534,587)


(4,689,626)

Total stockholders’ equity


3,052,394


2,687,266


3,198,264

TOTAL LIABILITIES AND STOCKHOLDERS’ EQUITY


$          10,434,582


$            9,704,995


$          10,458,694


DICK’S SPORTING GOODS, INC. AND SUBSIDIARIES

CONSOLIDATED STATEMENTS OF CASH FLOWS – UNAUDITED

(In thousands)


13 Weeks Ended


May 3,

2025


May 4,

2024

CASH FLOWS FROM OPERATING ACTIVITIES:


Net income


$            264,288


$            275,295

Adjustments to reconcile net income to net cash provided by operating
activities:


Depreciation and amortization


97,860


91,477

Amortization of deferred financing fees and debt discount


589


580

Deferred income taxes


23,174


12,100

Stock-based compensation


19,180


17,257

Other, net


17,730


100

Changes in assets and liabilities:


Accounts receivable


(22,061)


(29,146)

Inventories


(219,523)


(352,351)

Prepaid expenses and other assets


(19,682)


(22,918)

Accounts payable


57,098


192,488

Accrued expenses


(53,348)


7,563

Income taxes payable / receivable


53,553


48,218

Construction allowances provided by landlords


22,776


31,369

Deferred revenue and other liabilities


(30,516)


(21,798)

Operating lease assets and liabilities


(33,072)


(18,515)

Net cash provided by operating activities


178,046


231,719

CASH FLOWS FROM INVESTING ACTIVITIES:


Capital expenditures


(264,725)


(157,525)

Other investing activities


(120,968)


(474)

Net cash used in investing activities


(385,693)


(157,999)

CASH FLOWS FROM FINANCING ACTIVITIES:


Proceeds from exercise of stock options


61


12,293

Minimum tax withholding requirements


(31,106)


(30,300)

Cash paid for treasury stock


(303,671)


(108,629)

Cash dividends paid to stockholders


(99,921)


(94,395)

Decrease in bank overdraft


(12,092)


(4,772)

Net cash used in financing activities


(446,729)


(225,803)

EFFECT OF EXCHANGE RATE CHANGES ON CASH AND CASH EQUIVALENTS


325


(60)

NET DECREASE IN CASH AND CASH EQUIVALENTS


(654,051)


(152,143)

CASH AND CASH EQUIVALENTS, BEGINNING OF PERIOD


1,689,940


1,801,220

CASH AND CASH EQUIVALENTS, END OF PERIOD


$         1,035,889


$         1,649,077

DICK’S SPORTING GOODS, INC.

GAAP to NON-GAAP RECONCILIATIONS – UNAUDITED


Non-GAAP Net Income and Earnings Per Share Reconciliations

(dollars in thousands, except per share amounts)


13 Weeks Ended May 3, 2025


Selling, general

and

administrative

expenses

Income from

operations (3)

Other

expense

(income)

Income

before

income

taxes

Net

income (4)

Earnings

per diluted

share

GAAP Basis

$             785,528

$        366,116

$       6,256

$   347,722

$ 264,288

$             3.24

% of Net Sales

24.74 %

11.53 %

0.20 %

10.95 %

8.32 %


Investment losses (1)

(13,880)

13,880

10,271


Deferred compensation
   plan adjustments (2)

5,708

(5,708)

(5,708)


Non-GAAP Basis

$             791,236

$      360,408

$    (13,332)

$   361,602

$  274,559

$             3.37

% of Net Sales

24.92 %

11.35 %

(0.42) %

11.39 %

8.65 %


(1) Includes non-cash losses from non-operating investment in Foot Locker equity securities.

(2) Includes non-cash changes in fair value of employee deferred compensation plan investments held in rabbi trusts.

(3) Also referred to by management as earnings before interest, other expense or income and income taxes (“EBIT”).

(4) The provision for income taxes for non-GAAP adjustments was calculated at 26% which approximates the Company’s
     blended tax rate.


13 Weeks Ended May 4, 2024


Selling, general

and

administrative

expenses

Income from

operations (2)

Other

expense

(income)

Income

before

income

taxes

Net

income

Earnings

per diluted

share

GAAP Basis

$             743,399

$       330,799

$   (25,392)

$  342,356

$  275,295

$             3.30

% of Net Sales

24.63 %

10.96 %

(0.84) %

11.34 %

9.12 %


Deferred compensation plan adjustments (1)

(3,747)

3,747

3,747


Non-GAAP Basis

$             739,652

$       334,546

$    (21,645)

$  342,356

$  275,295

$             3.30

% of Net Sales

24.50 %

11.08 %

(0.72) %

11.34 %

9.12 %


(1) Included non-cash changes in fair value of employee deferred compensation plan investments held in rabbi trusts.

(2) Also referred to by management as earnings before interest, other expense or income and income taxes (“EBIT”).

Gross Capital Expenditures to Net Capital Expenditures Reconciliation

(in thousands) 


The following table represents a reconciliation of the Company’s gross capital expenditures to its capital expenditures, net
of construction allowances.


13 Weeks Ended


May 3,

2025


May 4,

2024

Gross capital expenditures


$                (264,725)


$                (157,525)

Construction allowances provided by landlords


22,776


31,369

Net capital expenditures


$                (241,949)


$                (126,156)

SOURCE DICK’S Sporting Goods, Inc.


Link

Continue Reading
Click to comment

Leave a Reply

Your email address will not be published. Required fields are marked *

Technology

Meta’s Oakley Smart Glasses Launch: Athletes Get Their AI Upgrade

Meta launched its first Oakley-branded smart glasses on June 20, targeting active users with enhanced durability and sports-focused features. The Oakley Meta HSTN costs $499 for the limited edition model, positioning itself $50 above the Ray-Ban Meta glasses while adding weather resistance and athletic functionality. The partnership expands Meta’s smart glasses beyond lifestyle users. EssilorLuxottica […]

Published

on


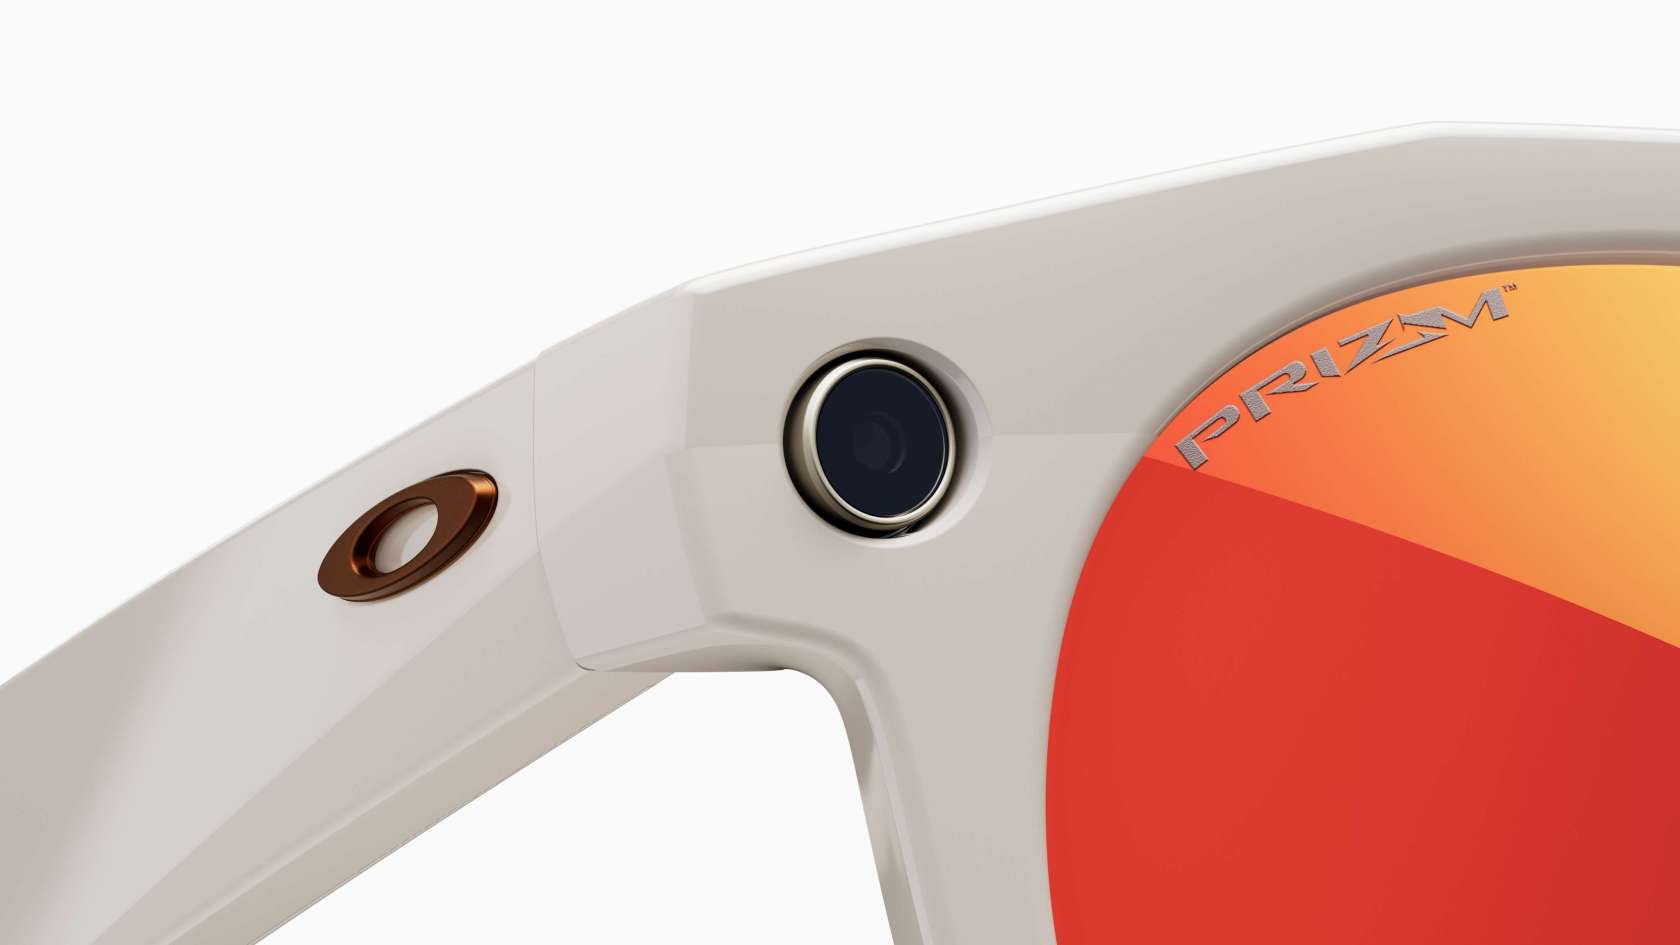
Meta launched its first Oakley-branded smart glasses on June 20, targeting active users with enhanced durability and sports-focused features. The Oakley Meta HSTN costs $499 for the limited edition model, positioning itself $50 above the Ray-Ban Meta glasses while adding weather resistance and athletic functionality.

The partnership expands Meta’s smart glasses beyond lifestyle users. EssilorLuxottica has sold millions of Ray-Ban Meta units since 2023, with many buyers using them for sports despite their urban design focus. The Oakley version addresses this gap directly with IPX4 water resistance and double the battery life of Ray-Ban models.

Performance That Actually Delivers

The HSTN delivers significant performance improvements over existing Meta glasses, and frankly, it’s about time. Battery life extends to eight hours of typical use and 19 hours on standby, compared to four hours for Ray-Ban Meta glasses. Anyone who’s experienced their Ray-Bans dying mid-conversation knows this upgrade matters. The charging case provides up to 48 hours of additional power, while rapid charging reaches 50% capacity in 20 minutes.

3K video recording capability surpasses the Ray-Ban version, capturing higher resolution footage for sports and outdoor activities. The built-in camera works with Meta AI for hands-free operation, allowing voice commands like “Hey Meta, take a video” during activities without fumbling for buttons or breaking your flow.

Open-ear speakers integrate into the frame design without blocking ambient sound, crucial for outdoor safety. The IPX4 water resistance rating protects against sweat and light rain, supporting use during intense physical activities where Ray-Bans might leave you worried about damage.

The Great Divide: Lifestyle vs Performance

The contrast between Meta’s two flagship offerings tells the story of how we actually live our lives:

Ray-Ban Meta Glasses:

  • Wayfarer and classic frame silhouettes that work everywhere
  • Subtle tech integration for daily wear
  • Fashion-forward materials and finishes
  • $449 starting price
  • Four-hour battery life (prepare for charging anxiety)
  • Urban and social media focus

Oakley Meta HSTN:

  • Wraparound athletic frame geometry that means business
  • Bold design language with visible tech elements
  • Performance-oriented materials and construction
  • $499 limited edition, $399 standard models
  • Eight-hour battery life with rapid charging
  • Sports and outdoor activity focus

The Ray-Ban version prioritizes discretion and style integration, making the smart features nearly invisible. After wearing Ray-Ban Wayfarers with transition lenses since launch, the versatility of adapting from indoor meetings to outdoor activities without switching glasses proves invaluable. The Oakley model takes the opposite approach, embracing its tech identity with prominent design elements and athletic aesthetics that practically shout performance capability.

Color Options That Actually Make Sense

The Oakley Meta HSTN launches with six distinct frame and lens combinations, each targeting specific use cases rather than just aesthetic preferences:

Limited Edition (July 11 preorder, $499):

  • Gold accents with 24K Prizm Polar lenses (for those who like their tech flashy)

Standard Collection (Summer 2025, starting at $399):

  • Desert frame with Prizm Ruby lenses
  • Black frame with Prizm Polar Black lenses (the safe choice for traditionalists)
  • Shiny Brown frame with Prizm Polar Deep-Water lenses
  • Black frame with Transitions Amethyst lenses
  • Clear frame with Transitions Grey lenses
  • Black frame with clear lenses

All frame and lens combinations support prescription lenses for an additional cost. For those who prefer understated options, the black frame variants offer familiar territory without sacrificing functionality.

Lens Technology That Actually Works

Select HSTN models feature Oakley’s Prizm lens technology, representing one of the most advanced innovations in sports optics. Prizm lenses enhance color, contrast, and detail by filtering specific wavelengths of light, making environments appear more vibrant and easier to navigate.

The Prizm variants target specific activities:

  • Prizm Ruby: Enhances contrast in bright conditions
  • Prizm Polar Black: Reduces glare with polarization
  • Prizm Polar Deep-Water: Optimized for water sports and fishing
  • Transitions Amethyst/Grey: Adapt to changing light conditions automatically

The Transitions options deserve special attention. Having used transition lenses extensively, their ability to seamlessly adapt from indoor fluorescent lighting to bright outdoor conditions eliminates the constant eyewear switching that plagues regular sunglasses users. This versatility becomes even more valuable when your glasses double as a computer, camera, and communication device.

This lens technology integration maintains Oakley’s optical performance standards while housing Meta’s camera and AI systems. The combination addresses a key limitation of many smart glasses, which often compromise optical quality for tech integration.

AI That Gets Athletics

Meta positions the HSTN as “Performance AI glasses” with sports-specific functionality that goes beyond basic voice commands. The AI assistant provides contextual information relevant to athletic activities, such as wind speed for golf shots or weather conditions for outdoor training.

Hands-free operation becomes crucial during physical activities where manual phone interaction interrupts performance. Voice commands handle photography, video recording, music control, and AI queries without breaking focus or rhythm. Try adjusting your phone settings mid-workout and you’ll understand why this matters.

The wraparound frame design provides better peripheral coverage than traditional rectangular frames, protecting against side glare and debris during outdoor activities. This design philosophy extends Oakley’s heritage in sports eyewear to smart glasses functionality.

Beyond Sports: Real-World Applications

Beyond athletic applications, the HSTN includes accessibility features that leverage Meta AI capabilities. The system can describe visual scenes for users with visual impairments and connect to the Be My Eyes network for volunteer assistance.

Live translation features support international travel and communication, while hands-free messaging enables communication during activities where phone access proves difficult or dangerous. These features work whether you’re navigating a foreign city or simply have your hands full with groceries.

Getting Your Hands on Them

Initial availability covers 15 countries including the US, Canada, UK, Ireland, France, Italy, Spain, Austria, Belgium, Australia, Germany, Sweden, Norway, Finland, and Denmark. Meta plans expansion to Mexico, India, and the United Arab Emirates later in 2025.

The staged rollout reflects Meta’s strategy of establishing market presence in developed economies before expanding to emerging markets where smart glasses adoption may follow different patterns.

What’s Coming Next

Meta confirmed additional Oakley models beyond the HSTN, including a cyclist-focused design based on Oakley’s Sphera frame geometry. This model will feature a centered camera position and aerodynamic frame profile optimized for competitive cycling and road sports.

The expanded Oakley partnership represents Meta’s broader strategy of segmenting smart glasses by lifestyle and use case rather than competing solely on general-purpose functionality. One size doesn’t fit all lifestyles, and Meta seems to finally understand this. Whether you prefer the understated elegance of Ray-Ban or the bold performance aesthetic of Oakley, the choice now exists without compromising on core smart features.


Link

Continue Reading

Technology

Tracking Global Tournaments: How Esports Events Are Shaping Travel Trends for a New Generation of Flyers – Travel Radar

Over the last decade, eSports has evolved from niche hobbyist competitions into a global phenomenon, attracting millions of viewers and fans across the globe. Major eSports tournaments now fill online betting sites in the UK and arenas with tens of thousands of spectators, rivaling traditional sports in scale, fan engagement, and economic impact. Beyond the […]

Published

on


Over the last decade, eSports has evolved from niche hobbyist competitions into a global phenomenon, attracting millions of viewers and fans across the globe. Major eSports tournaments now fill online betting sites in the UK and arenas with tens of thousands of spectators, rivaling traditional sports in scale, fan engagement, and economic impact.

Beyond the digital screens, eSports events are transforming real-life experiences, especially how the new generation travels and interacts with global destinations. This new popularity of travel driven by eSports fans, players, and organizers is reshaping patterns in tourism, airport management, and city branding. Let’s find out how!

eSports as a Global Attraction

eSports is no longer confined to local gaming lounges or online streaming platforms. Many major tournaments like The International (Dota 2), League of Legends World Championship, Fortnite World Cup, and CS:GO Majors are hosted in iconic locations like Madison Square Garden, the Mercedes-Benz Arena in Berlin, or the Accor Arena in Paris.

These events gather players from dozens of countries competing at an elite level, teams and organizations traveling with large support, as well as fans and tourists eager to witness their favourite teams and players live. They also accommodate media and sponsors, creating global content and activation campaigns.

In a nutshell, the scale and prestige have attracted partnerships with airlines, tourism boards, and governments aiming to capitalize on the lucrative eSports fanbase.

The New Generation of Global Travelers

eSports fans are particularly Millennials and Gen Z. These age groups are famous for their digital fluency and global connectivity. This generation appreciates experiences and is willing to travel internationally for events that they can relate to culturally and socially. There are a couple of characteristics that influence travel behaviour. They are as follows:

  • Tech-savviness — they rely heavily on mobile apps, social media, and online communities to plan and share travel experiences.

  • Community-driven travel — many fans organize group trips to events, turning tournaments into social festivals.

  • Extended stays — unlike traditional sports fans who might just attend the match, eSports spectators usually stay longer to explore the host city’s gaming culture, tech hubs, and nightlife.

  • Cost-conscious yet experience-oriented — they seek affordable travel options but prioritize dynamic and immersive event-related experiences.

eSports events bring together a highly international crowd. Fans and players from Asia, Europe, North America, Latin America, and increasingly Africa come together in select cities, creating a melting pot of cultures. This diverse influx promotes not only tourism but also cultural exchange, local economic stimulation, and increased global awareness.

Picture of a full plane taken from the inside showing the entertainment screens and lots of passengers in their seats
©Wikimedia Commons

Traditionally, international air travel hubs have focused on business and leisure tourism destinations. However, the surge of eSports is diverting demand toward cities hosting major tournaments — many of which are emerging markets eager to display themselves on the global stage.

For instance:

  • South Korea has been a centre for eSports, with Seoul hosting large-scale events. This has amplified inbound tourism through Incheon International Airport.

  • Cities like Jakarta, Manila, and Shanghai have experienced rising air traffic associated with hosting international eSports tournaments.

  • Even European cities like Warsaw, Berlin, and Stockholm have gained niche reputations as eSports hotspots, driving airline route expansions.

Airlines are responding by introducing new or more frequent flights to these cities. At times, they make schedules align with major tournaments, thereby boosting the flow of travelers.

Travel Packages & Themed Experiences

Travel agencies and online platforms now provide eSports-themed travel packages that merge tournament attendance with local experiences. They include VIP event access and meet-and-greets with professional players, gaming lounge visits and tech innovation tours, local cuisine and nightlife curated for younger travellers, and airport lounges equipped with gaming zones. These specialized packages attract not just hardcore eSports fans but also casual gamers and tourists curious about the industry, therefore expanding the market reach.

In-Flight Experiences

Airports and airlines are increasingly identifying eSports travellers as a valuable segment. Some airports have started including gaming lounges with consoles and PCs where travellers can play or watch eSports streams during layovers. Others offer high-speed internet and power outlets to cater to gaming device users. These enhancements encourage fans to fly more often.

Hybrid Event Models

Although real-time attendance at tournaments remains highly popular, hybrid models merging in-person and virtual participation are trending. Some fans might travel to regional hubs instead of the main event location to attend satellite viewing parties or fan festivals.

This flexibility generates complex travel patterns but equally widens opportunities for cities to tap into eSports tourism without hosting the entire event.

Creating a Unique & Interconnected World of eSports Tourism

eSports extends beyond a digital pastime. It is a powerful catalyst that transforms how and why a generation travels internationally.

For airlines, cities, and travel industry stakeholders, embracing the eSports-driven traveller is not just an opportunity — it is essential for remaining relevant in an evolving global tourism space. As eSports continues to grow, the journey from virtual competition to real-world adventure will only deepen tourism in different cities.


Link

Continue Reading

Technology

The Garmin Descent Mk3i is a 5-star dive watch that blows the Apple Watch Ultra 2 out the water

Why you can trust TechRadar We spend hours testing every product or service we review, so you can be sure you’re buying the best. Find out more about how we test. Garmin Descent Mk3i: Two-minute review Sitting at the top of Garmin’s recreational dive watch family, and by extension the best swimming watch for divers, […]

Published

on


Why you can trust TechRadar


We spend hours testing every product or service we review, so you can be sure you’re buying the best. Find out more about how we test.

Garmin Descent Mk3i: Two-minute review

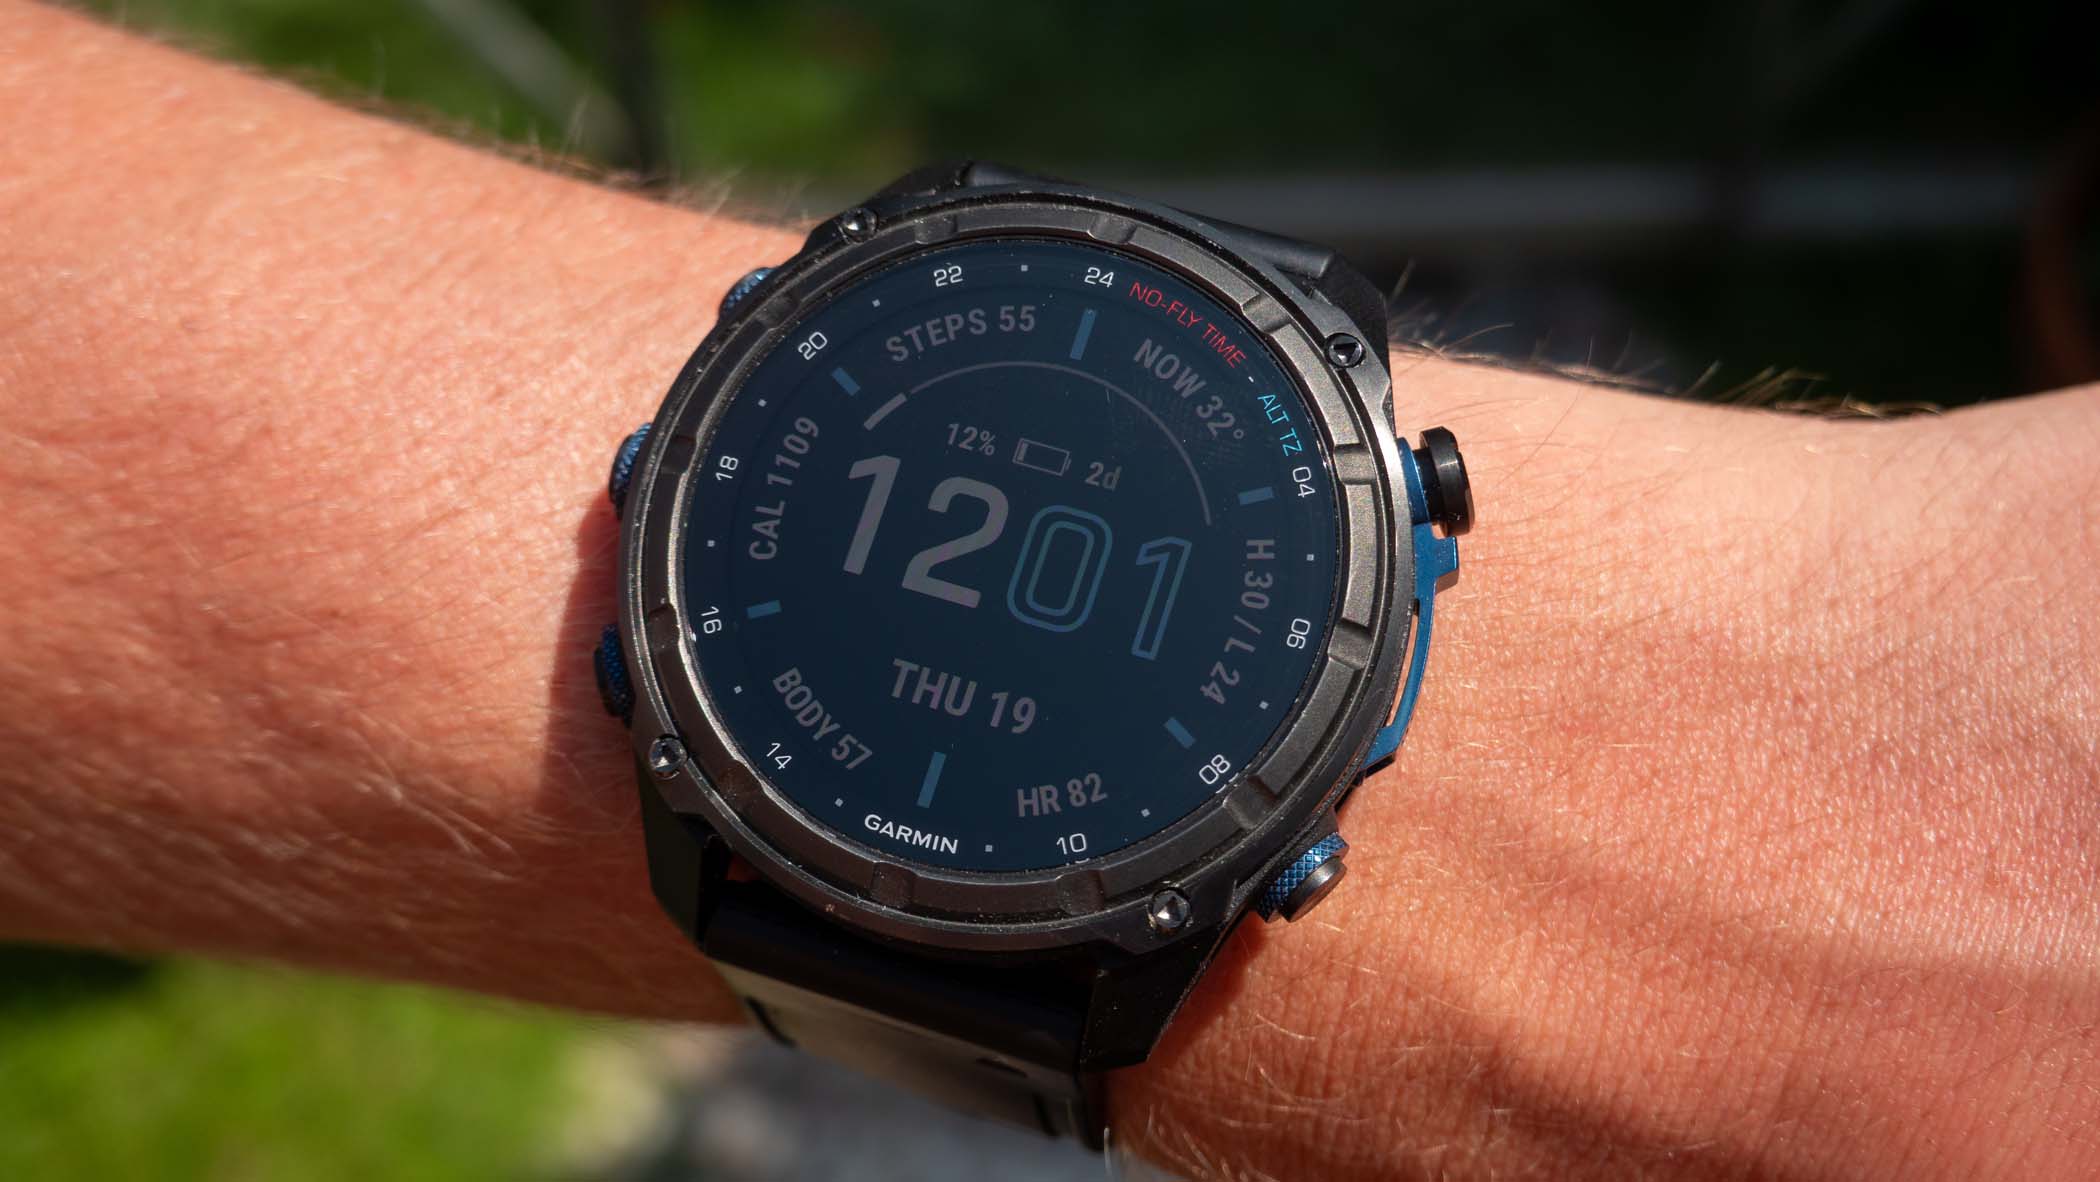
Sitting at the top of Garmin’s recreational dive watch family, and by extension the best swimming watch for divers, the Descent Mk3i’s AMOLED display – 43mm or 51mm – uses a scratch-resistant sapphire crystal lens – something that’s more important than you might realize in scuba diving, where you and your buddy can be exposed to a variety of hard materials like other watches, knives and the natural topography, such as rocks and wrecks.

I didn’t treat the Descent Mk3i any differently to how I dive with any of my own watches (slap it on and forget about it without being overly cautious), and so far, the display has proven to live up to its scratch-resistant claims. That titanium case has also held up well during testing, but be aware that the Mk3 without air integration is a stainless steel model.


Link

Continue Reading

Technology

Guwahati-based National Science Centre unveils new facilities bridging tradition and technology

Syllad | The Rising MeghalayaJune 21, 2025 The National Science Centre, Guwahati, under the Ministry of Culture’s National Council of Science Museums, inaugurated three major facilities on Thursday that blend traditional knowledge with scientific innovation and digital services. The new additions at the Centre’s Khanapara campus include the region’s first gallery on traditional medicines, a […]

Published

on


The National Science Centre, Guwahati, under the Ministry of Culture’s National Council of Science Museums, inaugurated three major facilities on Thursday that blend traditional knowledge with scientific innovation and digital services.

The new additions at the Centre’s Khanapara campus include the region’s first gallery on traditional medicines, a medicinal plant garden, and a chatbot-enabled, cashless online ticketing system. Together, they aim to spotlight the healing practices of Northeast India’s indigenous communities while embracing modern technology for public engagement.

Inaugurating the facilities, Assam Revenue Minister Keshab Mahanta praised the initiative for integrating ethnomedicinal knowledge into mainstream science education. “India’s traditional medicine systems are gaining global recognition, especially in primary healthcare. This effort not only honours our heritage but also aligns with future healthcare needs,” he said, noting the World Health Organization’s endorsement of traditional medicine as a key health resource.

The gallery on traditional medicines is the first in the region dedicated to the ethnomedicinal practices of local tribes and communities. It aims to educate visitors on the scientific basis of herbal remedies and their continued relevance in rural and primary healthcare. The medicinal garden, featuring a variety of native plants, serves both as an educational and conservation space.

The chatbot-based ticketing platform, developed as part of the Digital India initiative, offers a seamless, cashless experience for visitors, enhancing accessibility and convenience.

The event was opened with a welcome address by Centre Director Sujay Majumder, followed by remarks from Dr. Jaideep Baruah, Director of the Assam Science Technology and Environment Council (ASTEC), who emphasized the need to preserve and promote the region’s native plant species and healing traditions. The programme concluded with a vote of thanks by Dr. Jhuma Ghosh, Curator ‘C’.


Google News Button


syllad


Link

Continue Reading

Technology

Wood Sports Flooring Market Demonstrates Robust Growth

New Jersey, US State: “The global Wood Sports Flooring market in the Construction and Manufacturing category is projected to reach USD 3.14 billion by 2031, growing at a CAGR of 5.2% from 2025 to 2031. With rising industrial adoption and continuous innovation in Construction and Manufacturing applications, the market is estimated to hit USD 2.12 […]

Published

on


Wood Sports Flooring Market Demonstrates Robust Growth

New Jersey, US State: “The global Wood Sports Flooring market in the Construction and Manufacturing category is projected to reach USD 3.14 billion by 2031, growing at a CAGR of 5.2% from 2025 to 2031. With rising industrial adoption and continuous innovation in Construction and Manufacturing applications, the market is estimated to hit USD 2.12 billion in 2024, highlighting strong growth potential throughout the forecast period.”

Wood Sports Flooring Market Size & Forecast 2031

The Wood Sports Flooring market is anticipated to register notable growth through 2031, fueled by increasing construction of indoor sports facilities and rising preference for wooden surfaces in professional sports environments. Wood flooring is favored for its shock absorption, aesthetic appeal, and durability, making it ideal for basketball courts, gymnasiums, and multi-use sports arenas. Technological innovations in surface finishing and sustainability practices are further enhancing product performance and consumer appeal.

Growing awareness of athlete safety and performance is prompting sports infrastructure developers to invest in high-quality flooring systems, with engineered wood gaining prominence. Demand is particularly strong in developed regions due to modernization of sports complexes, while emerging economies are experiencing rising installations driven by government initiatives in sports promotion. This consistent upward trend signals strong opportunities for manufacturers and suppliers over the forecast period.

Key Players in the Wood Sports Flooring Market

Bona AB, Mannington Mills Inc., Gerflor, Haro Sports Flooring, Robbins Sports Surfaces, Aacer Flooring, Maple Flooring Manufacturers Association, Tarkett, Connor Sports, Zebra Sports, Hardwood Flooring Manufacturers Association

For Further Detail, Download the Sample PDF with Complete TOC, Tables, Figures, Charts, And More @ https://www.marketresearchintellect.com/download-sample/?rid=934437&utm_source=OpenprJune&utm_medium=047

Factors Supporting Growth of Wood Sports Flooring Market in the Future:

1.Technological Advancements and Innovation:

The continuous evolution of technology is playing a vital role in driving the Wood Sports Flooring market forward. Cutting-edge innovations are improving product functionality, enhancing performance, and reducing costs, making these solutions more accessible to a broader range of industries. Emerging technologies such as AI, IoT, advanced analytics, and automation are also enabling smarter and more efficient use cases, further expanding the scope of the market. These advancements are not only upgrading existing systems but are also creating entirely new application opportunities that will support long-term market expansion.

2. Expanding Applications Across End-Use Sectors:

The increasing integration of Wood Sports Flooring solutions across diverse industries such as automotive, healthcare, consumer electronics, telecom, and industrial manufacturing is significantly boosting market demand. Each sector brings unique requirements, pushing companies to diversify their offerings and customize solutions. This cross-industry relevance ensures consistent demand growth, while rising digitalization and adoption of smart technologies amplify the market potential across both developed and developing regions.

3. Favorable Government Policies and Infrastructure Push:

Supportive initiatives by governments around the world, including funding programs, tax incentives, and policy frameworks, are providing a strong foundation for market development. Efforts to strengthen digital infrastructure, promote energy efficiency, and drive sustainable development are fueling demand for advanced Wood Sports Flooring technologies. Moreover, public-private partnerships and national transformation agendas such as smart cities and Industry 4.0 are creating favorable conditions for rapid market expansion, especially in emerging economies

4. Increased Investment and Focus on Research & Development:

The Wood Sports Flooring market is experiencing a surge in investment from both private and public entities, driven by the urgency to innovate and stay competitive. Companies are dedicating substantial resources to research and development to create next-generation products with higher efficiency, scalability, and environmental sustainability. Venture capital funding, mergers, acquisitions, and collaborations are also contributing to a dynamic ecosystem that fosters experimentation and accelerates commercialization of novel solutions, ensuring sustained market growth in the future.

To avail a discount on the purchase of this report visit the link @ https://www.marketresearchintellect.com/ask-for-discount/?rid=934437&utm_source=OpenprJune&utm_medium=047

Key Segments Covered in Our Report: Wood Sports Flooring Industry

Wood Sports Flooring Market by Type

Solid Wood Flooring

Engineered Wood Flooring

Wood Sports Flooring Market by Application

Indoor Sports Facilities

Outdoor Sports Facilities

Wood Sports Flooring Market by End-User

Educational Institutions

Commercial Sports Facilities

Residential Users

The Application segment showcases the industries and sectors that use Wood Sports Flooring products for example Wood Sports Flooring targeting healthcare and automotive industries etc. It also provides a perspective of the market rate of acceptance, usage of the products, and new applications that are paving the way for the future of the market.

Global Wood Sports Flooring Market Regional Analysis

The Global Wood Sports Flooring Market is examined in dimensions of regions, wherein each region has its own market growth, trends as well as dynamics. This section highlights on the detailed market performance, major shifts, and trends and underlying factors explaining growth in different places around the world.

North America: North America accounts for a large share of the Wood Sports Flooring market which is a result of the developed technology, intense consumer market, and huge investments in the Wood Sports Flooring industry. To add, the U.S. market also plays a crucial role as this economy is more concerned with innovation and was also one of the first to implement Wood Sports Flooring products in its Wood Sports Flooring sectors. The region is expected to see a gradual rise till 2031 and this is because of its reinforced infrastructure and existing regulation mechanisms.

Europe: Global has the fastest growing Wood Sports Flooring market and is oriented around environmental protection, renewed efforts and environmental awareness. The market is dominated by countries like Germany, the UK, and France that have improved their technologies and have a strong industrial structure. Increased request for green solutions along with regulatory efforts are increasing demand in the market’s key areas such as Wood Sports Flooring sectors.

Asia-Pacific: The growth potential in the Wood Sports Flooring market is expected to be maximum for Asia-Pacific region. Increased maturation, urban migration as well as expanding middle class in China, India, and Japan and other developing economies are great constituents of market growth. Further, there is an increasing contribution to investments in the Wood Sports Flooring sector which is increasing the demand for Wood Sports Flooring regions-supplying throughout the area.

Rest of the World: Countries and areas like Latin America, Middle East & Africa have also been showing moderate Wood Sports Flooring market growth. Although still developing, these markets are fueled by a fast increasing infrastructure, expending industrial activities and growing consumer demand for Wood Sports Flooring goods. These regions pose great opportunities for the market players to tap into other sources of growth.

Frequently Asked Questions (FAQ) – Wood Sports Flooring Market

Q1: What is the anticipated growth rate of the Global Wood Sports Flooring Market?

A1: With a growth rate of CAGR of 5.2%, the Global Wood Sports Flooring Market is anticipated to reach USD 3.14 billion by 2031. Industrial demand and innovation will lead it to reach USD 2.12 billion by 2024.

Q2: Which regions provide the highest growth opportunities for the Wood Sports Flooring Market?

A2: Asia-Pacific is likely to provide the highest growth prospects based on speedy industrialization and infrastructure growth, followed by robust markets in Europe and North America.

Q3: Which are the primary drivers of market growth?

A3: The primary drivers are technology innovation, growing industrial applications, heightened government initiatives, and expanding use of Wood Sports Flooring solutions in different industries.

Q4: What are the challenges faced by the Wood Sports Flooring Market?

A4: The challenges are tight regulatory systems, high upfront capital expenditures, fragmentation of the market in the emerging markets, and geopolitical risks in some regions.

Q5: Which are the major players in the Global Wood Sports Flooring Market?

A5: The market has a number of leading players with a focus on innovation, strategic alliances, and global expansion.

Q6: How does innovation influence the Wood Sports Flooring Market?

A6: Market growth is driven by innovation, which enhances product efficiency, lowers costs, and facilitates new applications, making the overall market potential broader.

Q7: Which industries utilize Wood Sports Flooring products mostly?

A7: Major industries include manufacturing, automotive, energy, electronics, and infrastructure, among others, where Wood Sports Flooring solutions deliver operational efficiency and sustainability.

Q8: How is the market anticipated to change after 2031?

A8: Although projections beyond 2031 are uncertain, continued technological advancement and increasing industrial demand are expected to continue supporting long-run growth patterns.

For More Information or Inquiries, Visit @ https://www.marketresearchintellect.com/product/global-wood-sports-flooring-market/?utm_source=Linkedin&utm_medium=047

About Us: Market Research Intellect

Market Research Intellect is widely recognized as one of the leading global market research companies, with strong capabilities in data interpretation as well as business intelligence. Our objective is to support businesses in various sectors with relevant insight of their markets enabling them to make sound choices, expand and remain competitive in the changing business environment.

Backed with an expert team of analysts, we carry out detailed market assessment and market potential forecasts for a wide range of fields including but not limited to technology, healthcare, automotive, energy, and many more. This also includes market definition, development of market forecasts, trend analysis, analysis of competitive environment and core comprehensive market research that is necessary for the client.

As a focus, we always strive to provide accurate and reliable data, or if need be, tailored solutions to the problems and possibilities present in the market worldwide. With the use of novel research approaches, we are able to provide intelligence that will help organizations in the ever dynamic business world.

Should you have any queries, please contact us as follows:

Mr. Edwyne Fernandes

Market Research Intellect

APAC: +61 485 860 968

EU: +44 788 886 6344

Us: +1 743 222 5439

This release was published on openPR.


Link

Continue Reading

Technology

The Athletic Revolution: How Sports Transformed Through Crisis

The 2020-2021 worldwide pandemic transformed the world of global professional sports in basic ways that ring on throughout the sporting world. First, they were short-term improvisations to an unprecedented emergency, which, through the years, evolved into stable solutions that supplanted conventional models and ignited innovations that might have taken two decades to implement otherwise. The […]

Published

on


The 2020-2021 worldwide pandemic transformed the world of global professional sports in basic ways that ring on throughout the sporting world. First, they were short-term improvisations to an unprecedented emergency, which, through the years, evolved into stable solutions that supplanted conventional models and ignited innovations that might have taken two decades to implement otherwise.

The Empty Arena Period and Digital Shift

Perhaps most notably, stadiums fell silent as governments grappled with health regulations that prohibited mass gatherings. The absence of fans created an unprecedented environment in which players played in front of cameras rather than crowds, entirely altering the psychological dynamics of competition. Television shows adapted by incorporating artificial crowd noise and innovative camera angles to cover the unnatural quietness, which initially disappointed audiences and competitors alike.

Sports institutions rapidly turned to online engagement mechanisms, understanding that fan attachment had to be reinvented beyond territorial association. Leagues discovered that several found that virtual fan experience could complement attendance as opposed to being a mere substitute for it. The industry of betting experienced unprecedented expansion within this period, as many enthusiasts turned to online betting site platforms as an alternative means of engagement with stadiums closed. This shift was a part of an even broader revolution in sports consumption, as fans left behind passive watching and moved to active participation through new media.

The financial consequences were phenomenal as revenue sources that had sustained professional sports for generations literally evaporated. Gate receipts, concession sales, and merchandise income plummeted while broadcast partnerships became increasingly essential to organizational viability.

Health Protocols and Performance Modifications

Sports performance itself was put under the microscope as health measures introduced variables never previously accounted for in competitive sports. Regular testing protocols, quarantines, and contact tracing created scheduling uncertainties that required unprecedented flexibility from athletes, coaches, and administrators.

Training practices transitioned rapidly from conventional facilities, which are currently off-limits or restricted, as the world went online. Home training, online sessions, and reconfigured equipment arrangements became the new norm rather than a transitional measure. The provision of training availability through channels such as Melbet Instagram Bangladesh and similar social media avenues democratized opportunity for sportsmen to learn from each other and remain engaged while physically displaced. These changes revealed both sports preparation tractability and the importance of technological infrastructure in guaranteeing competitive readiness.

Competition formats themselves were overhauled. Tournament structures shortened, playoff systems were altered, and season durations adjusted to accommodate health-related breaks. These changes squeezed the elasticity of sports which had maintained relatively unchanged configurations for decades.

Technological Acceleration and Innovation

The pandemic accelerated the adoption of technology in almost all domains of the sports business. Video analysis software improved, wearable technology gained significance for broad health monitoring rather than performance metrics, and AI applications entered fields previously recognized as too sensitive for algorithmic control.

athletic revolution

Telecasting transformed beyond traditional coverage paradigms as networks experimented with immersive technology and interactive viewing. The following innovations came into prominence, particularly during this period:

  • Enhanced Statistical Enrichment: Real-time visualization of data became the standard, providing viewers with an unmatched depth of analysis within live broadcasts
  • Virtual Reality Experiences: Certain companies designed VR environments to allow viewers to observe games from different angles, like court-side and player views
  • Interactive Social Features: Live polling, prediction sports games, and social media integration made passive viewing active entertainment
  • Augmented Commentating Systems: AI-powered stat analysis tools provided commentators with real-time statistical comparison and historical context that had previously required tedious preparation

These innovations fundamentally reshaped viewer expectations and raised new standards for coverage of sports that extend beyond pandemic restraint.

Economic Restructuring and Market Adaptation

Financial models for professional sports were extensively recalibrated as traditional assumptions of revenue did not hold up in the crisis. Companies diversified revenue streams, expanded into new partnerships, and reworked core assumptions around market sustainability.

Revenue Stream Pre-Pandemic Status Pandemic Impact Post-Pandemic Evolution
Gate Receipts Primary income source Eliminated/Severely reduced Recovered with enhanced premium experiences
Broadcasting Rights Stable, predictable Renegotiated terms Expanded to include streaming platforms
Sponsorship Deals Traditional partnerships Creative digital integration Data-driven, performance-based agreements

The reorganization extended beyond the short-term financial concerns to incorporate long-term strategic considerations. The majority of organizations emerged with more robust digital infrastructure and diversified revenue sources that better protected them against subsequent shocks.

Legacy and Enduring Change

The effect of the pandemic on sport extends well beyond ad hoc health measures, creating enduring shifts in the structure, engagement with, and commercialization of sport. Remote working arrangements for administrative functions, enhanced digital supporter experiences, and flexible competition formats are now the norm instead of being the exception.

The athletes themselves became more flexible and tech-literate, abilities which boost competitive as well as long-term professional performance. The crisis demonstrated that innovation often stems from the need to be driven, which suggests that sporting organizations would be well advised to regularly question prevailing wisdom even without external pressures.

Rather than following the previous pandemic norm, the sports world has embraced a hybrid model that combines old-fashioned tradition with improved technology and operating room flexibility—a movement that ultimately solidified the ground upon which modern athletics continues to move ahead.


Link

Continue Reading

Most Viewed Posts

Trending